
 English
 Français
 Deutsch
 Português
 Türkçe
 Italiano
 العربية
 Русский
 Chinese
 Korean
 Japanese
 Vietnamese
 Hebrew
 Hindi
Hindi
 Greek
Greek
 Polish
 Thai
Thai
 Dutch
Dutch
 Malay
Malay
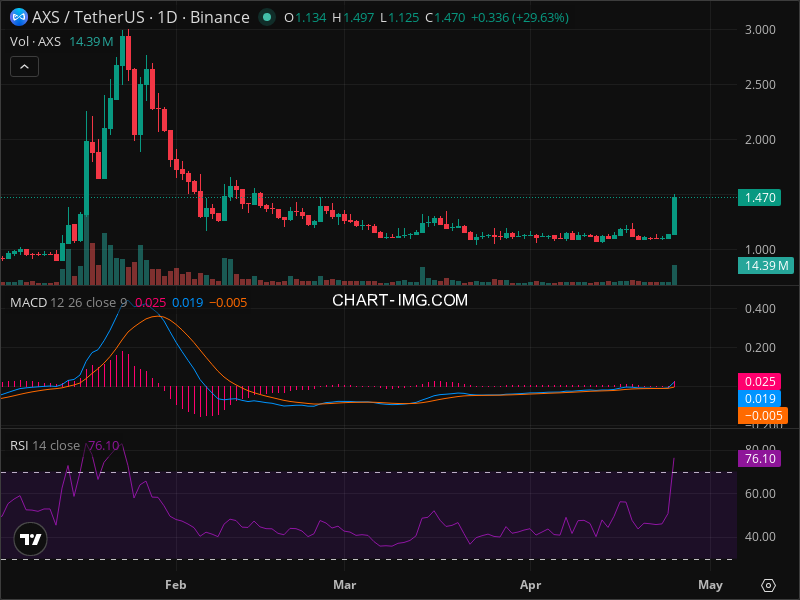
AXS at Critical Level: Why This Week Matters
The world of cryptocurrency is buzzing, and right at the center of the storm is Axie Infinity Shards (AXS). With a breathtaking 29.63% surge today alone, investors and traders are clamoring to understand what’s happening and what might come next. AXS is not just another digital asset; it’s a key player in the blockchain ecosystem that fans and investors are watching closely as potential developments unfold.
But why the frenzy now? AXS is capturing the spotlight across social media platforms and crypto forums. Is this upward trajectory based on solid fundamentals or merely the result of speculative hype? Understanding the driving forces behind this rally could mean the difference between capitalizing on a lucrative opportunity or getting caught in a volatile downside.
Market Context: What’s Fueling the Fire?
The backdrop for AXS’s explosive rise is a global market that screams "Risk-On." The S&P 500 and NASDAQ-100 are climbing, displaying an appetite for risk-fed gains. But it doesn’t stop there. With the U.S. dollar weakening, a favorable environment is formed for riskier assets, such as cryptocurrencies, to thrive. The drop in bond yields further supports this risk-on sentiment, enticing more investors to embark on higher-risk ventures like AXS.
With the macroeconomic winds at its back, AXS isn’t just riding the coattails of a favorable market climate. It’s outshining it. But how long can this momentum last? The specifics of today’s surge demand scrutiny, especially with market watchers glued to their screens for any potential shifts.
The Current Setup: AXS on the Rise
Today, AXS isn’t just participating in the rally; it’s leading it. This cryptocurrency is moving faster than a cheetah on the hunt, smashing through expectations and leaving analysts scrambling to make sense of the charts. A massive green candlestick marks the day, but the immediate question is whether this is a sustainable ascent or a fleeting rise.
The strong bullish trend is undeniable, yet the Relative Strength Index (RSI) warns of overbought conditions. Traders must weigh the exhilaration of rapid gains against the risks of a potential correction. With the recent high nudging the $1.50 resistance level, every tick upward keeps traders on edge. Support lines at $1.125 offer some consolation, but in a market governed by emotion as much as data, every move counts.
Technical Deep Dive: The Crucial Signals
Technical indicators are the bread and butter for many traders, and AXS is serving a feast. Starting with the market regime, the broader economic setting is undeniably optimistic. The U.S. dollar’s decline and the bond yield drop provide a solid foundation for risky assets like AXS to flourish.
Yet, there’s a catch. The RSI is ringing alarm bells, hitting 76.10, a zone known for prompting sell-offs when the market overheats. While the MACD has shown a bullish crossover, suggesting further gains, the extent of this price jump already might imply that the signal has burned out some of its potency.
Layered atop these indicators are critical support and resistance levels—$1.50 as the immediate resistance and $1.125 as the nearby support, with psychological milestones like $1.00 in play. The absence of clear Fibonacci levels due to insufficient historical data adds an element of unpredictability. Chart patterns remain elusive; the recent spike seems more an isolated incident than the establishment of a new trend.
The Three Scenarios: Mapping the Future
In the intricate dance of market speculation, three primary scenarios stand out for AXS, each carrying its own weight of likelihoods and price targets.
Bullish Scenario:
- Conditions: Maintained risk-on sentiment, potential positive news about AXS's market expansions, or breakthroughs in its insurance-related applications.
- Targets: A stretch towards $2.00 and possibly $2.50, breaking resistance barriers.
- Probability: 35%
- Timeframe: 1-2 weeks
Bearish Scenario:
- Conditions: A correction driven by the high RSI, a shift to risk-off sentiment, or negative news impacting AXS’s credibility.
- Targets: A fallback to $1.125 or potentially diving to the psychological support at $1.00.
- Probability: 45%
- Timeframe: 1-2 weeks
Neutral/Consolidation Scenario:
- Range: Prices might oscillate between $1.125 and $1.50, offering only brief opportunities.
- Duration: 1-3 weeks
- Probability: 20%
Trading Strategy: Navigating AXS Waters
For those eyeing a position in AXS, caution is key. As the RSI suggests overbought conditions, a hasty entry could be perilous. A strategic mindset would recommend waiting for a pullback, potentially entering the market at $1.30-$1.35 after a correction.
- Stop Loss: Establish at $1.10 to manage risk.
- Take Profit 1: Consider $1.50 as the first target.
- Take Profit 2: Aim for $1.80 if the market momentum persists.
- Risk/Reward Ratio: Seek a balanced 1:2.2 for favorable odds.
Risk Factors: Unseen Pitfalls
The world of cryptocurrency is notoriously unpredictable. AXS could face a swift downturn if market conditions shift or if unexpected news impacts its standing. The high RSI indicates a looming pullback, and with inherent crypto volatility, a strategic size of position—about 1-2% of total capital—is recommended.
The Bottom Line: Final Thoughts on AXS
In the wild ride of AXS, traders must be vigilant. Despite the dazzling gains, the risks of a correction loom large. Holding a currently volatile asset requires an ironclad strategy and nerves of steel.
Key Takeaways:
- AXS surged by 29.63%, outperforming the S&P 500 and NASDAQ-100.
- The RSI at 76.10 indicates overbought conditions, warning of a correction.
- Critical resistance at $1.50 and support at $1.125 guide entry and exit strategies.
- Probability for a bearish correction stands at 45%.
- A measured approach suggests entering post-correction at $1.30-$1.35.
- Risk management through a stop loss at $1.10 is vital.
- Traders should remain alert for fundamental shifts impacting AXS.
- Engage AI-powered analysis for real-time alerts and insights.
- Smaller position sizes reduce exposure to unforeseen downturns.
Final Verdict Table:
Final Verdict
| Decision | Value |
|---|---|
| ACTION | HOLD |
| Confidence Level | 65% |
| Entry Price | $1.32 (after correction) |
| Stop Loss | $1.10 |
| Take Profit | $1.50 (initial), $1.80 (extended) |
| Risk/Reward | 1:2.2 |
| Success Probability | 45% (based on technical setup) |
| Timeframe | 1-2 weeks |
WHY THIS TRADE: Current conditions suggest volatility with a potential correction. The defined entry point after a pullback provides a more secure entry.
WHAT MUST HAPPEN: A hold above $1.125 to validate the bullish outlook and sustain momentum.
FAQ:
Sources:
- Investing.com: AXS Market Trends - Read more
- Zacks Investment Research: AXS Long-Term Value - Read more
Ready to Trade AXS Like a Pro?
InteractiveCrypto Pro gives you the edge with:
- AI-Powered Signals - 94% accuracy
- Real-time Fair Value Estimates
- 40+ Technical Indicators
- Instant alerts on key levels
50% OFF - Just $6.49/month
Compare Your Options:
Find the best analysis tools for your strategy.


COMMENTS (0)