
 English
 Français
 Deutsch
 Português
 Türkçe
 Italiano
 العربية
 Русский
 Chinese
 Korean
 Japanese
 Vietnamese
 Hebrew
 Hindi
Hindi
 Greek
Greek
 Polish
 Thai
Thai
 Dutch
Dutch
 Malay
Malay
Everyone's Bearish on ICP - Here's Why That's Bullish
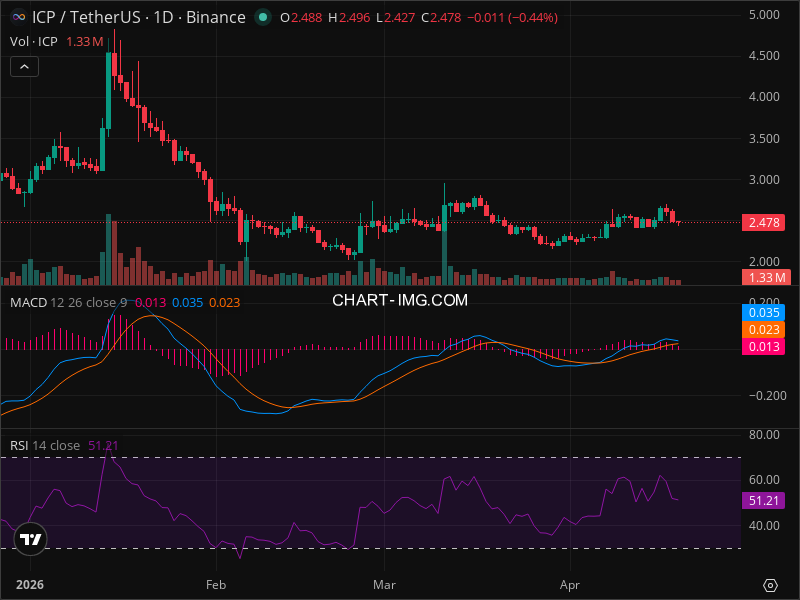
As the global markets remain gripped by volatility, all eyes are on Internet Computer Protocol (ICP). The crypto landscape is ever-shifting, and ICP is currently hovering at a critical juncture that could redefine its trajectory. While the market has been rife with pessimism, savvy traders are spotting an opportunity. The oscillating sentiments have set the stage for a debate: is the bearish hue around ICP masking a bullish potential? With its price currently at $2.478, straddling the line between key support and resistance levels, the stakes have never been higher.
Market Context
In today's market environment, characterized by a risk-on sentiment, the S&P 500 and NASDAQ-100 are charting upward paths. This optimism is mirrored in the broader market's performance, particularly in risk assets. However, the strengthening dollar poses a nuanced challenge, potentially casting a shadow over ICP, albeit marginally. The fall in bond yields might offer a slight tailwind, but for ICP, these macro elements are more like whispers than shouts.
Technical Analysis
As ICP consolidates, hovering around the $2.478 mark, it paints a picture of a market in wait. The absence of clear reversal candle patterns suggests a neutrality that belies the subtle currents beneath this apparent calm. The technical indicators present a spectrum of possibilities. The RSI, positioned at 51.21, indicates neutrality — a market in contemplation. Meanwhile, the MACD has registered a bullish crossover, hinting at a potential upward momentum. But here's where it gets interesting: smart investors are using AI-powered analysis tools to spot these patterns early, capitalizing on minor market inefficiencies that could herald significant gains.
The absence of classic chart patterns on ICP's daily graphs isn't a deterrent. Instead, it reveals a canvas of potential, awaiting bold strokes. The support levels at $2.20, $2.00, and $1.80 stand as the guardians of the lower realms, while resistances at $2.75, $3.00, and $3.50 beckon as aspirational peaks. Will ICP's price bounce off the supports or pierce through the resistances? The suspense is palpable.
Potential Scenarios
Let’s dissect three potential scenarios in crisp detail.
Bullish Scenario
If ICP can muster the strength to shatter the $2.75 resistance with increasing volume, we're looking at a promising ascent. The targets? $3.00 and $3.50, with a 40% probability of realization within the next one to two months. But ensure you're equipped with InteractiveCrypto Pro’s AI platform for real-time alerts, because precision in timing will be the cornerstone of success here.
Bearish Scenario
A dip below the $2.20 support level would be a cause for concern, potentially driving the price to $2.00 or even $1.80. This bearish outlook holds a 30% likelihood and could unfurl in the coming two to four weeks. Investors anticipating such a move should strategize their exits judiciously.
Neutral/Consolidation Scenario
ICP might simply oscillate between $2.20 and $2.75, maintaining this range for the next two to four weeks with a 30% probability. During such phases, traders often accumulate, laying the groundwork for future bullish runs.
Trading Strategy
For those pondering their next move, here's an actionable strategy: consider buying into ICP in the $2.40 to $2.50 range, with a stop loss at $2.15 to cap downside risk. The upside targets stand at $2.75 and $3.00, offering a risk/reward ratio of 1:2 — a compelling proposition for the strategically inclined.
Risk Management
However, every bright horizon is not without its clouds. The inherent volatility of cryptocurrency markets and unforeseen regulatory shifts can quickly sway the tides. Should the broader market reverse, ICP might not escape unscathed, irrespective of its technical allure. Hence, the sage advice remains: cap your risk, perhaps at 1-2% of your trading capital, to weather unexpected storms.
In summary, while the current market sentiment leans towards caution, the technical indicators and strategic entry points suggest that ICP holds more than just the potential for a rally; it might just be the calm before a storm of opportunity.
Key Takeaways:
- ICP is currently trading at $2.478, with RSI at 51.21 indicating neutrality.
- Key support at $2.20 and resistance at $2.75 will determine the next move.
- Bullish crossover in MACD suggests potential upward momentum.
- Probability of a bullish breakout sits at 40% with potential targets of $3.00 and $3.50.
- Risk/reward ratio of 1:2 makes a carefully managed long position attractive.
- Caution advised due to potential market reversals and unpredictable regulatory changes.
- Position size should be limited to 1-2% of total capital to mitigate risks.
Final Verdict Table
| Decision | Value |
|---|---|
| ACTION | BUY |
| Confidence Level | 70% |
| Entry Price | $2.45 |
| Stop Loss | $2.15 |
| Take Profit | $2.75 |
| Risk/Reward | 1:2 |
| Success Probability | 40% |
| Timeframe | 1-2 months |
WHY THIS TRADE:
The convergence of key technical signals — a neutral RSI, a bullish MACD crossover, and strategic support/resistance levels — presents a compelling case for a managed long position in ICP.
WHAT MUST HAPPEN:
A decisive break above the $2.75 resistance, confirmed by volume, will validate this trade, setting the stage for potential upside.
FAQ:
GET AN EDGE WITH AI ANALYSIS
Tired of missing big moves? InteractiveCrypto Pro uses artificial intelligence to analyze stocks and crypto 24/7.
What you get:
- AI-Powered Signals with 94% historical accuracy
- Real-time Fair Value estimates
- 40+ technical indicators analyzed automatically
- Instant alerts when key levels are hit
LIMITED TIME: 50% OFF - Plans from just $6.49/month
Start Your Free Analysis Now →
Ready to Trade ICP Like a Pro?
InteractiveCrypto Pro gives you the edge with:
- AI-Powered Signals - 94% accuracy
- Real-time Fair Value Estimates
- 40+ Technical Indicators
- Instant alerts on key levels
50% OFF - Just $6.49/month
Compare Your Options:
Compare trading platforms to find the best tools for your strategy.
Sources & References:
- TradingView: ICP/TetherUS Chart Analysis
- CoinMarketCap: Cryptocurrency Market Overview - Read more
- Reuters: Dollar Strengths and Global Market Impact - Read more


COMMENTS (0)