
 English
 Français
 Deutsch
 Português
 Türkçe
 Italiano
 العربية
 Русский
 Chinese
 Korean
 Japanese
 Vietnamese
 Hebrew
 Hindi
Hindi
 Greek
Greek
 Polish
 Thai
Thai
 Dutch
Dutch
 Malay
Malay
PLTR at Critical Level: Why This Week Matters
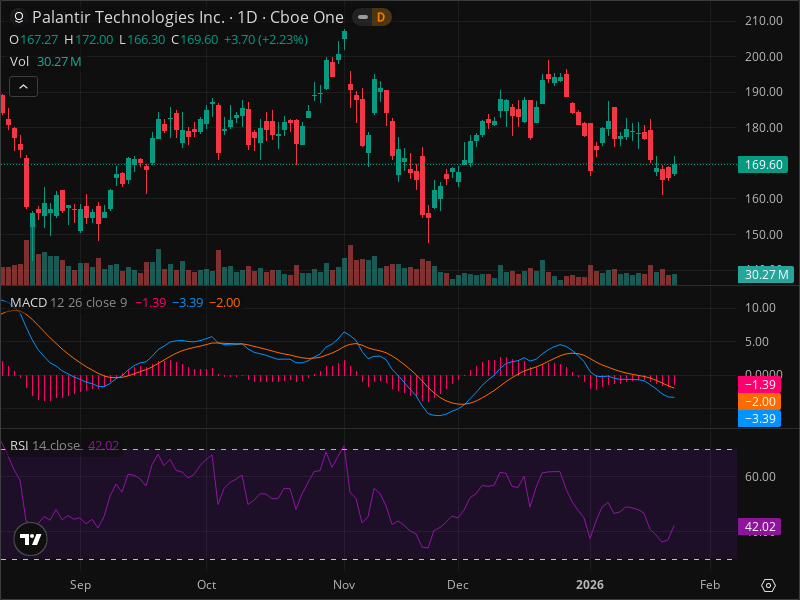
In an electrifying market landscape, few stocks are under the microscope quite like Palantir Technologies (PLTR). This week, all eyes are on PLTR as it dances along a critical support level, poised for either a dramatic breakout or a precipitous fall. With Wall Street analysts sounding alarms on overvaluation, and technical indicators in a delicate balance, the stakes have never been higher. This is the moment where fortunes could be made—or lost.
As the S&P 500 and NASDAQ-100 continue to show marginal gains, the macroeconomic environment points towards a moderate "Risk-On" sentiment. This is crucial for PLTR, a technology and growth stock, as it benefits from a weakened dollar and falling bond yields. But here's where it gets interesting: despite these favorable conditions, analysts have issued stark warnings about potential overvaluation. The challenge for investors is cutting through the noise to discern whether PLTR's current setup presents a golden opportunity or a potential trap.
Technical Analysis
The real intrigue unfolds as we delve into the technicals. PLTR's recent price action shows a stock attempting to consolidate after a correction from its highs. Trading at $169.60, it's testing the waters between strong support at $166.30 and resistance at $172. The importance of these levels cannot be overstated. A break above $172, especially with strong volume, could signal a bullish turn, while a breach below $166.30 might spell trouble. Furthermore, the Relative Strength Index (RSI) at 42.02 suggests neither overbought nor oversold conditions, yet a looming MACD crossover hints at potential bullish momentum.
For those using AI-powered analysis tools, such as InteractiveCrypto Pro, this setup is precisely the type of scenario where automated signals and real-time alerts can provide an edge. Spotting the early indicators of a breakout or breakdown is crucial, and having AI in your corner can tip the scales in your favor.
Potential Scenarios
The table is set for three potential scenarios. In a bullish outlook, a MACD crossover and a volume-confirmed break above $172 could propel PLTR towards targets of $180 and $190, with a 40% probability. On the downside, a failure at key support levels could see the stock retrace to $160 or even $150, carrying a 30% likelihood. Meanwhile, a neutral consolidation between $160 and $172 remains equally plausible, offering a 30% chance.
Trading Strategy
Trading strategies hinge on precise entry and exit points. For those ready to seize the moment, buying near support at $166.30, with a stop loss at $160, offers a calculated risk. Profit targets are set at $172 and $180, forming a risk/reward ratio of 1:2.03. With volatility and market sentiment in play, a cautious approach with a small position size is advisable.
Risks to Consider
However, there are inherent risks. Market volatility, negative headlines about Palantir, or a shift to "Risk-Off" sentiment could derail the best-laid plans. Moreover, should PLTR fail to break resistance or face downgrades from analysts, as recently suggested, the bullish thesis could unravel.
In conclusion, while PLTR presents a tantalizing opportunity, navigating its complexities requires precision and vigilance. As technical indicators align and market conditions evolve, the coming days will be pivotal. For investors with a keen eye on PLTR, this week could define their trading outcomes.
Key Takeaways:
- PLTR is trading at $169.60, testing support at $166.30 and resistance at $172.
- RSI indicates neutral conditions at 42.02, while MACD hints at a bullish crossover.
- Three scenarios: Bullish (40% probability), Bearish (30%), Neutral (30%).
- Buy near support with a stop loss at $160; targets at $172 and $180.
- Use AI analysis tools like InteractiveCrypto Pro for real-time alerts.
FINAL VERDICT
| Decision | Value |
|---|---|
| ACTION | BUY |
| Confidence Level | 70% |
| Entry Price | $166.30 |
| Stop Loss | $160 |
| Take Profit | $180 |
| Risk/Reward | 1:2.03 |
| Success Probability | 60% |
| Timeframe | 4 weeks |
WHY THIS TRADE: This recommendation is driven by the potential MACD crossover, favorable market regime, and PLTR's consolidation at strong support levels.
WHAT MUST HAPPEN: A volume-confirmed breakout above $172 validates the bullish scenario, while a close below $160 negates it.
FAQ
Sources:
- Motley Fool: "Jefferies Analyst Brent Thill Projects Palantir Could Fall 57%" - Read more
- Wall Street Journal: "Is Palantir Really Overvalued?" - Read more
Ready to Trade PLTR Like a Pro?
InteractiveCrypto Pro gives you the edge with:
- AI-Powered Signals - 94% accuracy
- Real-time Fair Value Estimates
- 40+ Technical Indicators
- Instant alerts on key levels
50% OFF - Just $6.49/month
Start Free Analysis →Compare Your Options:
Compare trading platforms to find the best tools for your strategy.
Compare Platforms →


COMMENTS (0)