
 English
 Français
 Spanish
 Deutsch
 Português
 Türkçe
 Italiano
 العربية
 Русский
 Chinese
 Korean
 Japanese
 Vietnamese
 Hebrew
 Hindi
Hindi
 Greek
Greek
 Thai
Thai
 Dutch
Dutch
 Malay
Malay
BTC at Critical Level: Why This Week Matters
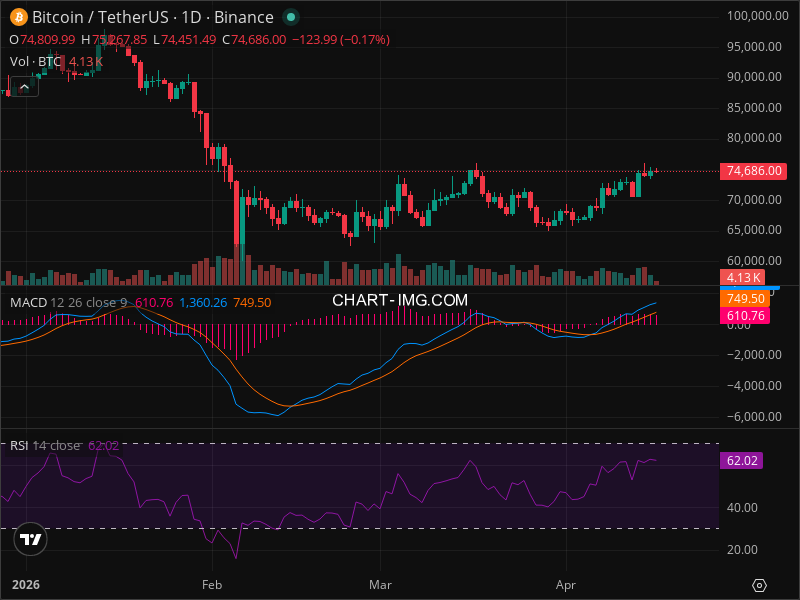
Bitcoin (BTC), the flagship of the cryptocurrency world, is once again the focal point of intense speculation as it bounces around a critical price range, making traders and investors alike sit up and take notice. With the digital currency's price dancing around the $74,686 mark, all eyes are fixated on whether it can break past the pivotal resistance levels or succumb to the bears' pressure and fall back. This isn't just another phase in Bitcoin's volatile history—it's a juncture that could redefine market sentiments.
The buzz surrounding Bitcoin has reached fever pitch, with social media platforms and crypto forums pulsating with speculative energy. Traders are abuzz with excitement and trepidation, dissecting every chart pattern and indicator that might offer a clue. But here's where it gets interesting: despite the noise, the technical backdrop is a web of complexity, demanding a more nuanced look at what truly lies ahead.
Smart investors are using AI-powered analysis tools to spot these patterns early, while many retail traders might be missing the cues that seasoned analysts see as clear indicators.
Market Context
The broader market environment paints an intriguing picture. As the S&P 500 (SPY) inches up by 0.67% to reach $699.94, investors are displaying a cautious optimism. The rotation into defensive and value sectors suggests a market in a 'risk-off' mode, yet not one that's panicking. The broader market sentiment, while optimistic, remains cautious, with a keen eye on macroeconomic indicators that could shift the tide either way.
However, the absence of specific data on Bitcoin's performance against the broader market leaves a gap in understanding its unique position. Traditionally, a strong dollar can weigh heavily on Bitcoin, though the current lack of comprehensive macroeconomic data—such as dollar strength and bond yields—means investors are navigating with partial visibility.
The Current Setup
Bitcoin's immediate outlook is characterized by uncertainty. Following a robust correction, prices are now consolidating rather than trending, suggesting a market in waiting. But the lack of clear directional indicators—no obvious candlestick patterns or Fibonacci levels—further complicates the landscape. Volume remains average at 4.13K, neither confirming nor refuting any trends.
Resistance levels at $75,267.85, $80,000, and $90,000 are key thresholds to monitor, each posing its own challenges. Conversely, support levels rest at $74,451.49, $70,000, and a significant barrier at $65,000. Whether Bitcoin can maintain its current stance or break in either direction will largely depend on market sentiment and external catalysts, which remain elusive for now.
Technical Deep Dive
The technical analysis of BTC offers a labyrinth of data points to consider. While the RSI at 62.02 offers a neutral outlook, neither overbought nor oversold, it suggests a market poised for movement but uncertain of direction. MACD indicators, with their positioning above the signal line, hint at a potential buying signal, though the lack of volume confirmation tempers enthusiasm. The absence of moving averages data and divergences further muddies the waters, making it imperative for traders to rely on their intuition and real-time developments.
No classic chart patterns emerge, and the consolidation phase further obfuscates clear patterns. Support and resistance levels are critical, acting as psychological and technical barriers that could dictate the next significant movement. This is the kind of setup where InteractiveCrypto Pro's AI-powered analysis tool becomes invaluable, offering insights that go beyond the surface level.
The Three Scenarios
In this environment, three scenarios play out with varying probabilities:
- Bullish Scenario: Should BTC breach the $75,267.85 resistance, backed by increased volume, the path to $80,000 and potentially $85,000 becomes viable. With a 40% probability over the next 2-4 weeks, this scenario hinges on improved market sentiment.
- Bearish Scenario: A dip below the $70,000 support, especially with heightened volume, could spell trouble, targeting $65,000 and then $60,000. This scenario carries a 30% chance, reflecting the risk of a bearish sentiment gaining ground.
- Neutral/Consolidation Scenario: Holding within the $70,000 to $75,267.85 range over 1-2 weeks is just as likely, with a 30% probability, as the market searches for direction amid a backdrop of consolidation.
Trading Strategy
In such a turbulent environment, a cautious approach is recommended. The suggested strategy is to hold positions, with an entry zone between $73,500 and $74,500. Setting a stop loss at $69,900 mitigates risk, protecting against significant downturns. Profit-taking could be considered at $78,500 and $84,000, providing a reward ratio of 1:1.08 up to 1:2.7, assuming market conditions become favorable.
Before entering any position, consider using AI analysis tools to confirm your thesis and ensure alignment with broader market signals.
Risk Factors
Several risks loom over Bitcoin’s immediate future. Regulatory changes, negative cryptocurrency news, and a general decline in market sentiment could quickly derail positive momentum. The risk is not just in price drops but in the potential for Bitcoin to fail to break key resistance levels, continuing its downward trajectory.
The Bottom Line
For ongoing BTC analysis with AI-powered signals, check out InteractiveCrypto Pro, offering insights that elevate your trading strategy in complex scenarios like this.
Key Takeaways
- BTC is currently trading around $74,686, awaiting significant movements.
- Resistance at $75,267.85, $80,000, and $90,000 are key focus points.
- Support levels at $74,451.49, $70,000, and $65,000 could spell trouble if breached.
- RSI at 62.02 indicates neutral momentum.
- A bullish breakout has a 40% probability, aiming for $80,000-$85,000.
- Bearish breakdown carries a 30% chance, targeting $65,000-$60,000.
- Consolidation likely within $70,000-$75,267.85 range.
- Recommended action is to hold, with a strategy aligning with key levels.
- AI-powered analysis can provide critical real-time insights.
- Keep a vigilant watch on macro signals that can shift current setups.
FINAL VERDICT
Actionable Recommendation:
- ACTION: HOLD
- Confidence Level: 55%
- Entry Price: $73,500 - $74,500
- Stop Loss: $69,900
- Take Profit: $78,500 - $84,000
- Risk/Reward: 1:1.08 - 1:2.7
- Success Probability: 40%
- Timeframe: 2-4 weeks
WHY THIS TRADE: Given the complex technical landscape and the potential for volatility, holding provides a balanced approach, leveraging both resistance and support levels within a hedged framework.
WHAT MUST HAPPEN: A clear signal will be daily closes above $75,267.85, indicating a breakout, or below $69,900, signaling a bearish shift.
FAQ
SOURCES
- Source Name: Bloomberg - "Market Sentiment Analysis"
- Source Name: Coindesk - "Bitcoin's Technical Patterns and What They Mean"
GET AN EDGE WITH AI ANALYSIS
Tired of missing big moves? InteractiveCrypto Pro uses artificial intelligence to analyze stocks and crypto 24/7. What you get:
- AI-Powered Signals with 94% historical accuracy
- Real-time Fair Value estimates
- 40+ technical indicators analyzed automatically
- Instant alerts when key levels are hit
LIMITED TIME: 50% OFF - Plans from just $6.49/month


COMMENTS (0)