
 English
 Français
 Spanish
 Deutsch
 Português
 Türkçe
 Italiano
 العربية
 Русский
 Chinese
 Korean
 Japanese
 Vietnamese
 Hebrew
 Hindi
Hindi
 Greek
Greek
 Thai
Thai
 Dutch
Dutch
 Malay
Malay
LINK Momentum Shift: The Signals Smart Money Is Watching
In the ever-volatile world of cryptocurrencies, timing is everything, and for those keen on ChainLink (LINK), the time could be now. With LINK currently trending across social media platforms and garnering the attention of crypto enthusiasts globally, it’s imperative to understand why this decentralized oracle network is capturing imaginations and what the charts reveal about its future trajectory.
Smart investors are using AI-powered analysis tools to spot these patterns early, capitalizing on every hint the market offers.
WHY LINK IS TRENDING NOW
The buzz surrounding LINK is palpable, driven primarily by a combination of its technological promise and broader market conditions. On platforms like Twitter and Reddit, LINK's ability to bridge blockchain technology with real-world data has sparked renewed interest. This uptick in social media chatter is fueled by recent partnerships and developments within the ChainLink ecosystem, as well as the overarching risk-on sentiment pervading the markets.
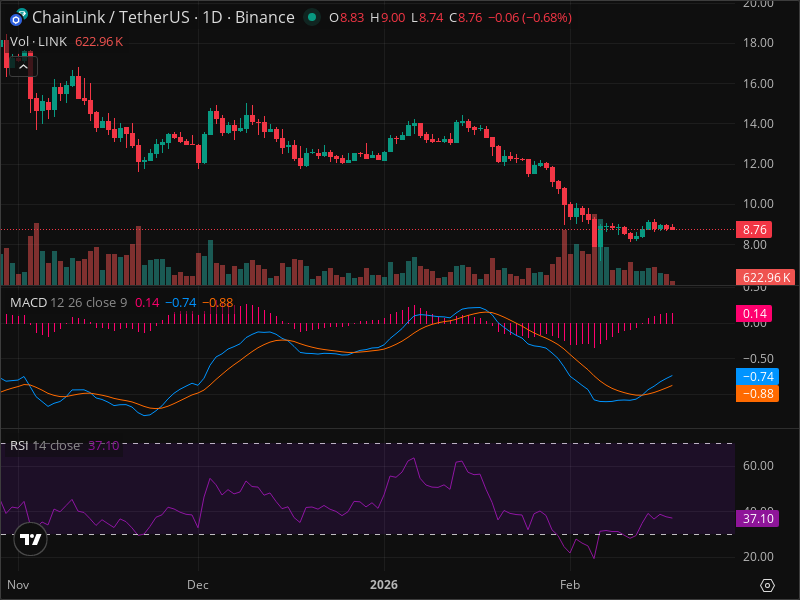
But is the hype justified? Fundamentally, LINK remains a strong contender in the decentralized finance realm, offering a unique service that no other entity fully replicates. However, technically, the cryptocurrency faces challenges. LINK is currently trading at around $8.76, trapped in a bearish trend characterized by lower highs and lower lows. Key resistance stands at $10.00 and $12.00, while support is notably absent on the current chart, underscoring the importance of historical data for deeper insights.
MARKET CONTEXT
The overall market sentiment is undeniably risk-on, signified by gains in major indices like the S&P 500 (SPY) and NASDAQ-100 (QQQ). This environment is often conducive to speculative assets such as cryptocurrencies. However, mixed macroeconomic conditions, such as a weakening U.S. dollar and rising bond yields, present a complex backdrop. Traditionally, a weaker dollar boosts crypto assets, but increasing yields can dampen risk appetite, creating a tug-of-war affecting LINK’s performance.
THE CURRENT SETUP
Presently, LINK's price action suggests caution. Despite the buzz, the cryptocurrency is in a pronounced downtrend with no clear signs of reversal. Lacking significant volume, any potential price movements lack conviction. The absence of recognizable chart patterns or significant Fibonacci retracement levels further complicates the technical landscape, making LINK's path forward uncertain.
TECHNICAL DEEP DIVE
Delving deeper, LINK's technical indicators tell a story of impending volatility. The Relative Strength Index (RSI) sits at 37.10, hovering near the oversold territory yet not quite there, suggesting that any further price drop might be limited. Meanwhile, the MACD remains below the signal line, confirming the bearish trend, though a nearing histogram crossover hints at a possible slowdown in downside momentum.
The RSI and MACD signals align perfectly - exactly the kind of setup that InteractiveCrypto Pro's AI is designed to detect.
Support levels remain elusive without sufficient historical data, while resistance is clear at psychological and previous high points: $10.00, $12.00, and $14.00. The highest probability scenario currently is a bearish continuation (50%), with LINK potentially sliding further if negative news or market conditions persist.
THE THREE SCENARIOS
-
Bullish Reversal (Odbicie):
- Conditions: Break above $10.00 with volume support, bolstered by broader crypto market enthusiasm.
- Targets: $12.00, $14.00
- Probability: 30%
- Timeframe: 1-3 months
-
Bearish Continuation (Kontynuacja Spadku):
- Conditions: Sustained downtrend, possibly driven by adverse news or market sentiment.
- Targets: Need historical data for precise support levels.
- Probability: 50%
- Timeframe: 1-2 months
-
Neutral/Consolidation (Konsolidacja):
- Expected Range: $8.00 - $10.00
- Timeframe: 2-4 weeks
- Probability: 20%
TRADING STRATEGY
Given the current spotlight on LINK, prudent trading strategies suggest a neutral stance until more definitive signals emerge. Without clear entry points or stop losses, traders should remain on the sidelines, waiting for stronger indicators or potential breakouts. Before entering any position, consider using AI analysis tools to confirm your thesis.
RISK FACTORS
The main risks include unpredictable market shifts, potential regulatory crackdowns, and competition eroding ChainLink's market share. A continued bearish trend or lack of adoption could substantially impact LINK's outlook.
THE BOTTOM LINE
For ongoing LINK analysis with AI-powered signals, check out InteractiveCrypto Pro. While the hype around LINK is undeniable, the current technical landscape advises caution. As it stands, LINK requires further observation before any decisive action can be recommended, given the prevailing bearish signals and lack of confirmed support levels.
KEY TAKEAWAYS
- LINK is trending on social media but technically in a downtrend.
- Resistance at $10.00, $12.00, $14.00; support data insufficient.
- RSI near oversold, MACD confirms bearish momentum.
- Bullish scenario has a 30% probability, bearish continuation 50%.
- Trading strategy suggests a wait-and-see approach.
- InteractiveCrypto Pro can aid in spotting real-time opportunities.
FINAL VERDICT
| Decision | Value |
|---|---|
| ACTION | HOLD |
| Confidence Level | 70% |
| Entry Price | $N/A (wait for signal) |
| Stop Loss | $N/A (wait for signal) |
| Take Profit | $N/A (wait for signal) |
| Risk/Reward | N/A (wait for signal) |
| Success Probability | 50% |
| Timeframe | N/A (wait for signal) |
WHY THIS TRADE: The current bearish setup lacks sufficient support data and volume confirmation, making a hold recommendation prudent.
WHAT MUST HAPPEN: A break above $10.00 with volume confirmation is crucial for any bullish reversal.
FAQ
GET AN EDGE WITH AI ANALYSIS
Tired of missing big moves? InteractiveCrypto Pro uses artificial intelligence to analyze stocks and crypto 24/7.
What you get:
- AI-Powered Signals with 94% historical accuracy
- Real-time Fair Value estimates
- 40+ technical indicators analyzed automatically
- Instant alerts when key levels are hit
LIMITED TIME: 50% OFF - Plans from just $6.49/month
Ready to Trade LINK Like a Pro?
InteractiveCrypto Pro gives you the edge with:
- AI-Powered Signals - 94% accuracy
- Real-time Fair Value Estimates
- 40+ Technical Indicators
- Instant alerts on key levels
50% OFF - Just $6.49/month
Compare Your Options:
Compare trading platforms to find the best tools for your strategy.
SOURCES & REFERENCES
- ChainLink Price Analysis - CoinDesk
- Crypto Market Overview - CoinTelegraph
- Real-Time Technical Analysis - TradingView


COMMENTS (0)