đŸ’č Vous ĂȘtes sĂ©rieux au sujet d'investir en 2026 ? DĂ©bloquez des dĂ©cisions plus intelligentes avec 50 % de rĂ©duction sur InteractiveCryptoPro.
×

{[{item.pair.split("_")[0]}]}

${[{item.price.toLocaleString(undefined, {maximumFractionDigits: 4})}]}

{[{item.change24}]}% Vol {[{ item.volume.toLocaleString(undefined, {maximumFractionDigits: 2}) }]} USDT

+{[{item.change24}]}% Vol {[{ item.volume.toLocaleString(undefined, {maximumFractionDigits: 2}) }]} USDT

Interactivecrypto does not accept users from your country (Israel)

Cotton Technical Analysis

news_img

May 26, 2026 | 

49 Views | 

Joanna Newman | 

Cotton Technical Analysis Chart
Cotton Chart | TradingView

Cotton Trading: A Comprehensive Guide to Success

Cotton, a globally traded commodity, presents unique opportunities for traders. Understanding the nuances of the cotton market, employing effective strategies, and utilizing the right analysis tools are crucial for success. This guide provides a comprehensive overview of cotton trading, covering everything from market fundamentals to advanced trading techniques.

Understanding the Cotton Market

The cotton market is influenced by a variety of factors, including weather patterns, global demand, government policies, and economic conditions. Key cotton-producing countries include India, China, the United States, and Brazil. Monitoring these factors is essential for making informed trading decisions.

Factors Influencing Cotton Prices

  • Weather conditions in major cotton-growing regions
  • Global demand for textiles
  • Government subsidies and trade policies
  • Currency fluctuations
  • Inventory levels
"Successful cotton trading requires a deep understanding of the factors that influence supply and demand."

Cotton Trading Strategies

Several trading strategies can be employed in the cotton market, including trend following, breakout trading, and range trading. The choice of strategy depends on the trader's risk tolerance, time horizon, and market conditions. Utilizing an AI-powered platform can help identify optimal trading opportunities.

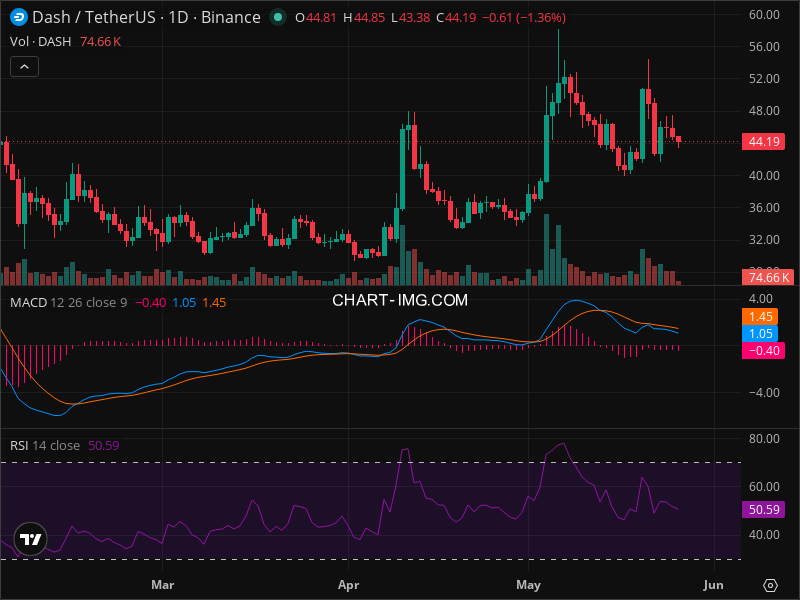
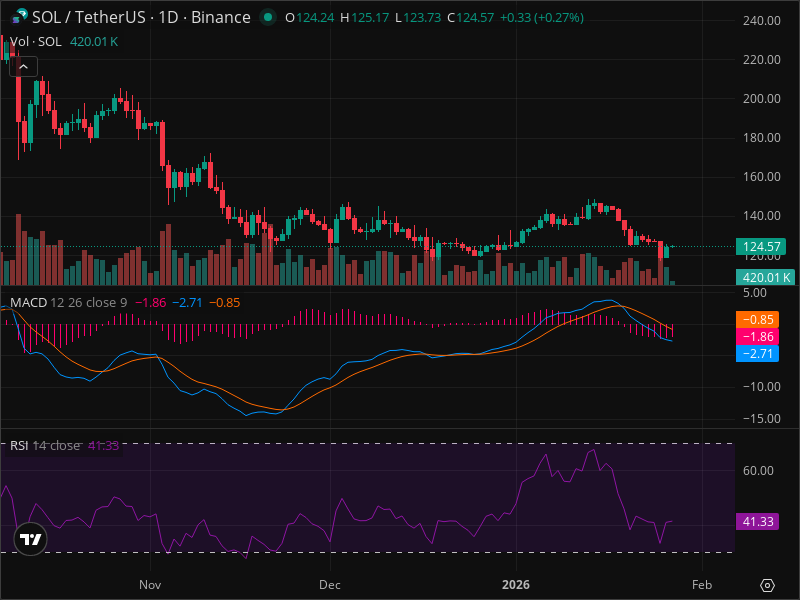
Technical Analysis for Cotton Trading

Technical analysis involves studying price charts and using indicators to identify potential trading opportunities. Common technical indicators used in cotton trading include moving averages, relative strength index (RSI), and MACD. InteractiveCrypto Pro offers a suite of technical analysis tools to help traders make informed decisions.

Fundamental Analysis for Cotton Trading

Fundamental analysis involves evaluating the underlying factors that affect the supply and demand of cotton. This includes analyzing weather reports, government policies, and economic data. Combining technical and fundamental analysis can provide a more comprehensive view of the market.

Risk Management in Cotton Trading

Risk management is crucial for protecting capital and ensuring long-term profitability in cotton trading. Implementing stop-loss orders, managing position size, and diversifying your portfolio are essential risk management techniques. A reliable trading platform can help you implement these strategies effectively.

Key Risk Management Techniques

  • Setting stop-loss orders to limit potential losses
  • Managing position size to control risk exposure
  • Diversifying your portfolio to reduce overall risk
  • Using leverage cautiously

Key Takeaways

Cotton trading offers significant opportunities but requires a thorough understanding of the market, effective strategies, and robust risk management. Utilizing advanced trading platforms like InteractiveCrypto Pro can enhance your trading performance.

Choosing the Right Trading Platform

Selecting the right trading platform is essential for a successful trading experience. Look for a platform that offers real-time data, advanced charting tools, and reliable order execution. Consider platforms like InteractiveCrypto Pro for its comprehensive features and user-friendly interface.

FAQ: Cotton Trading

What are the key factors that influence cotton prices?
Weather conditions, global demand, government policies, and currency fluctuations are key factors.
What is technical analysis and how is it used in cotton trading?
Technical analysis involves studying price charts and using indicators to identify potential trading opportunities.
How can I manage risk in cotton trading?
Implement stop-loss orders, manage position size, and diversify your portfolio.
What should I look for in a cotton trading platform?
Real-time data, advanced charting tools, and reliable order execution are essential features.

Did you like this article?

INFOS

COMMENTS (0)

Une classe magistrale d'investissement :
147% en moins de 2 ans

Notre sélectionneur d'actions alimenté par l'IA Plus de trois fois the S&P 500 over the past two years. How did your portfolio do?

Obtenez les actions
Investment performance chart
Crypto Market Analysis
Données du marché des cryptomonnaies sans bruit
Informations claires conçues pour soutenir des décisions plus intelligentes
Voir les informations

LIVE RATES

ALL

TENDANCE

Total Market Cap The Total Market Capitalization (Market Cap) is an indicator that measures the size of all the cryptocurrencies.It’s the total market value of all the cryptocurrencies' circulating supply: so it’s the total value of all the coins that have been mined.

{[{ marketcap }]} {[{ marketcapchange.toLocaleString(undefined, {maximumFractionDigits:2}) }]}% (24H) {[{ marketcapchange.toLocaleString(undefined, {maximumFractionDigits:2}) }]}% (24H)

Symbol

Prix Cryptocurrency prices are volatile, and the prices change all the time. We are collecting all the data from several exchanges to provide the most accurate price available.

24H Cryptocurrency prices are volatile
 The 24h % change is the difference between the current price and the price24 hours ago.

Acheter

{[{ item.name }]}
   {[{ index + $index}]}     {[{ item.pair.split('_')[0] }]}

Ƀ{[{item.price.toLocaleString(undefined, {maximumFractionDigits: 5}) }]} ${[{item.price.toLocaleString(undefined, {maximumFractionDigits: 5}) }]}

{[{ item.change24.toLocaleString(undefined, {maximumFractionDigits: 2}) }]}%

{[{ item.change24.toLocaleString(undefined, {maximumFractionDigits: 2}) }]}%

Acheter

Showing {[{ showing }]}

Symbol

Prix Cryptocurrency prices are volatile, and the prices change all the time. We are collecting allthe data fromseveral exchanges to provide the most accurate price available.

24H Cryptocurrency prices are volatile
 The 24h % change is the difference between the current priceand the price24 hours ago.

Acheter

{[{ item.name }]}
   {[{ index + $index}]}     {[{ item.pair.split('_')[0] }]}

Ƀ{[{item.price.toLocaleString(undefined, {maximumFractionDigits: 5}) }]} ${[{item.price.toLocaleString(undefined, {maximumFractionDigits: 5}) }]}

{[{ item.change24.toLocaleString(undefined, {maximumFractionDigits: 2}) }]}%

{[{ item.change24.toLocaleString(undefined, {maximumFractionDigits: 2}) }]}%

Acheter

Showing {[{ showing_trend }]}
Crypto investments are risky and may not suit retail investors; you could lose your entire investment. Understand the risk — click here
Crypto Market Analysis
Voir le risque avant que les prix ne bougent
Indicateurs de volatilité et de force pour la sensibilisation au marché
Analyser le risque

QUOI DE NEUF

INFOS

REVUE

BROKERS

PORTEFEUILLES

Crypto Market Analysis
Données du marché des cryptomonnaies sans bruit
Informations claires conçues pour soutenir des décisions plus intelligentes
Voir les informations

RÉCEMMENT CONSULTÉS

DERNIÈRE VISITE

LES PLUS VUS

Crypto Market Analysis
Données du marché des cryptomonnaies sans bruit
Informations claires conçues pour soutenir des décisions plus intelligentes
Voir les informations