
 English
 Français
 Spanish
 Deutsch
 Português
 Türkçe
 العربية
 Русский
 Chinese
 Korean
 Japanese
 Vietnamese
 Hebrew
 Hindi
Hindi
 Greek
Greek
 Polish
 Thai
Thai
 Dutch
Dutch
 Malay
Malay
FIL at Critical Level: Why This Week Matters
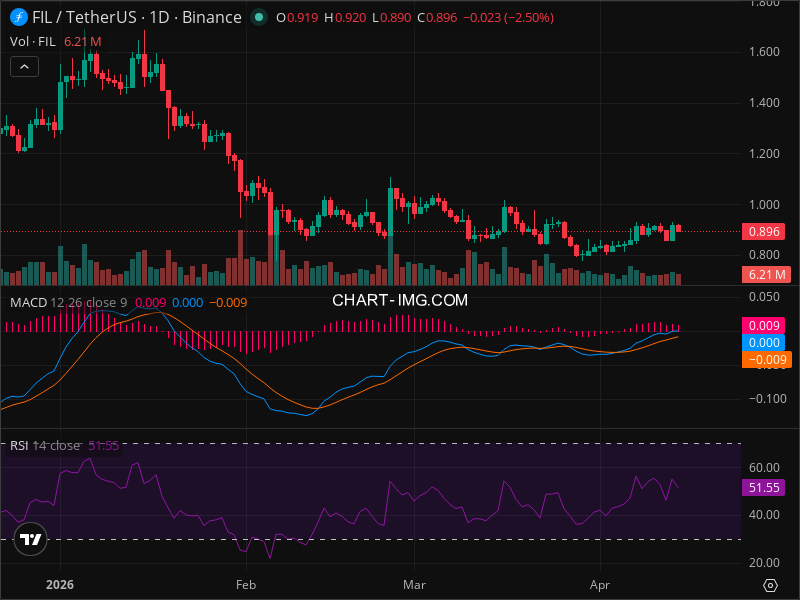
The cryptocurrency market is in a frenzy, with FIL at the center of a critical juncture. As traders worldwide closely watch the movements of Filecoin (FIL) against Tether (USDT) on Binance, pivotal technical indicators are converging, suggesting that the coming days could define the asset’s trajectory for weeks to come. With FIL currently priced at $0.896, the market is poised on the edge of either a breakout or a breakdown. Why does this moment matter so much? Because the next shift could mean the difference between a swift gain or a stark decline. This isn't just another market fluctuation—it's a defining moment.
Smart investors are using AI-powered analysis tools to spot these patterns early, leveraging platforms like InteractiveCrypto Pro to stay ahead of the curve. With a bullish market regime and macro conditions signaling risk-on sentiment, the stage is set for potentially significant movements.
In the broader market context, major indices such as the S&P 500 (SPY) and NASDAQ-100 (QQQ) are on an upward trajectory, indicating a favorable environment for risk assets. The weakening of the US dollar, evidenced by the decline of the UUP, further boosts the attractiveness of cryptocurrencies like FIL to international investors. Simultaneously, rising long-term Treasury securities (TLT) suggest a decline in yields, which can shift investor focus towards higher-risk, higher-reward assets. But here's where it gets interesting: despite these favorable macro conditions, FIL has shown a slight dip of 2.50% today, hinting at potential underperformance compared to the broader market.
In this dynamic scenario, FIL finds itself grappling with a neutral or consolidative trend. After a significant decline, its price has stabilized within a narrow range, creating a suspenseful atmosphere as traders await its next move. The key support and resistance levels—$0.80 and $0.92, respectively—are under scrutiny, with a potential breakout above the Fibonacci retracement level of 78.6% at $1.00 serving as a psychological barrier. Yet, as volume remains modest at 6.21M, the conviction behind recent movements remains tepid.
Delving deeper into the technicals, the RSI stands at 51.55—indicative of a range-bound state—while the MACD's recent bullish crossover lacks the momentum of robust follow-through. Without clear chart patterns like Head & Shoulders or Double Tops, FIL's price action remains highly unpredictable, with potential scenarios ranging from bullish rallies to bearish retreats.
The current technical setup reveals three main scenarios for FIL's near future. A bullish breakout, with a 35% probability, would see FIL surge past $0.92, targeting $1.00 and $1.14. Conversely, a bearish breach of $0.80 holds an equal probability, pointing towards targets of $0.75 and $0.70. The potential for extended consolidation within the $0.80-$0.92 range stands at 30%.
For traders eyeing the perfect entry, a cautious approach suggests entering between $0.87 and $0.92, with a stop loss at $0.79 to mitigate risk. Taking profits could be strategically set at $0.97 and $1.05, offering a risk-reward ratio of 1:2.4. Before entering any position, consider using AI analysis tools to confirm your thesis and refine your strategy.
Yet, the path ahead isn't without its perils. The crypto arena is notoriously volatile, and shifts in market sentiment or adverse events specific to FIL could derail even the most robust technical setups. This uncertainty underscores the importance of moderating position sizes, recommending an allocation of just 1-2% of trading capital.
The bottom line? As FIL navigates this pivotal moment, investors must remain vigilant, adapting quickly to any shifts in support or resistance levels. For ongoing FIL analysis with AI-powered signals, check out InteractiveCrypto Pro to stay informed and make data-driven decisions.
Key Takeaways:
- Market regime: Risk-on, with SPY and QQQ rising.
- FIL Price: $0.896, underperforming slightly.
- Key support: $0.80 and $0.75.
- Resistance levels: $0.92 and $1.00 (Fibonacci 78.6%).
- RSI: 51.55 (neutral); MACD: Bullish crossover, weak momentum.
- Bullish scenario: 35% probability, target $1.00-$1.14.
- Bearish scenario: 35% probability, target $0.75-$0.70.
- Consolidation: 30% probability within $0.80-$0.92.
- Recommended action: Hold, with a target entry at $0.87-$0.92.
FINAL VERDICT
Decision: HOLD
Confidence Level: 60%
Entry Price: $0.87 - $0.92
Stop Loss: $0.79
Take Profit: $0.97 and $1.05
Risk/Reward: 1:2.4
Success Probability: 60%
Timeframe: 1-2 weeks
WHY THIS TRADE: The lack of strong directional momentum coupled with the current market conditions suggests a hold strategy. This allows traders to benefit if the price breaks resistance and captures gains from the potential rise.
WHAT MUST HAPPEN: A breakout above $0.92 with increased volume confirms the bullish scenario, while a drop below $0.79 would invalidate the current thesis.
FAQ:
Sources:
- TradingView: FIL/TetherUS Technical Chart - Read more
- Investing.com: S&P 500 Market Updates - Read more
- CoinDesk: Crypto Market Analysis - Read more
Ready to Trade FIL Like a Pro?
InteractiveCrypto Pro gives you the edge with:
- AI-Powered Signals - 94% accuracy
- Real-time Fair Value Estimates
- 40+ Technical Indicators
- Instant alerts on key levels
50% OFF - Just $6.49/month
Start Free Analysis →Compare Your Options:
Compare trading platforms to find the best tools for your strategy.
Compare Platforms →GET AN EDGE WITH AI ANALYSIS
Tired of missing big moves? InteractiveCrypto Pro uses artificial intelligence to analyze stocks and crypto 24/7.
What you get:
- AI-Powered Signals with 94% historical accuracy
- Real-time Fair Value estimates
- 40+ technical indicators analyzed automatically
- Instant alerts when key levels are hit
LIMITED TIME: 50% OFF - Plans from just $6.49/month
Start Your Free Analysis Now →


COMMENTS (0)