
 English
 Français
 Spanish
 Deutsch
 Português
 Türkçe
 العربية
 Русский
 Chinese
 Korean
 Japanese
 Vietnamese
 Hebrew
 Hindi
Hindi
 Greek
Greek
 Polish
 Thai
Thai
 Dutch
Dutch
 Malay
Malay
WMT at Critical Level: Why This Week Matters
In a market swirling with mixed signals and ever-volatile price actions, Walmart (WMT) stands at a crucial juncture. The retail behemoth's future seems poised on a knife-edge as technical indicators and market conditions align for a potential decisive move. With the broader market leaning towards a bullish stance, the coming days could define WMT's trajectory for weeks, if not months, ahead. Here's why this could be a critical moment for investors keeping a close eye on one of the world's largest retailers.
The S&P 500 shows resilience, notching a modest gain at $689.23, while the tech-heavy NASDAQ-100 outpaces with a 0.48% rise to $622.72, signaling a "Risk-On" market sentiment. This backdrop sets the stage for individual stocks like WMT to either ride the wave of optimism or falter under the weight of sector-specific challenges. As the U.S. Dollar Index (UUP) slips 0.81%, the potential for WMT to capitalize on its international competitiveness increases, albeit slightly. Meanwhile, the tick-up in 20+ Year Treasury Bonds (TLT) hints at easing inflation pressures, possibly invigorating consumer spending—an essential lever for WMT's growth.
But here's where it gets interesting: WMT's recent price action reads like a suspense thriller. After a brief rally, the stock's trend has taken a turn, showing signs of indecision with a potential Doji candlestick pattern appearing on the chart. This uncertainty is compounded by the low volume in recent declines, suggesting that bearish momentum may lack conviction—yet another puzzle piece investors must consider.
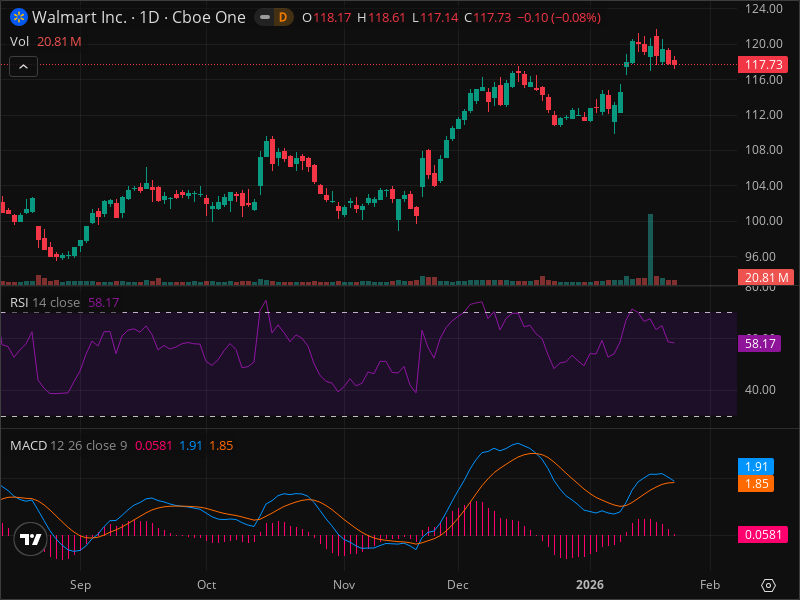
Support and resistance levels add another layer to this complex tapestry. WMT faces immediate resistance at $118.61, with critical support at $117.14. Beyond these, the chart whispers of stronger psychological barriers at $120.00 and $124.00, hinting at potential upside targets should bullish momentum take hold. Conversely, watch for potential pitfalls with support levels down to $112.00 and $108.00, particularly if the stock breaches its crucial threshold of $115.50.
Investors eyeing the intricate dance of technical indicators might find the RSI at 58.17, a neutral zone that keeps the door open for either direction. The MACD, while slightly positive, shows signs of weakening momentum—a subtle warning that should not be ignored. In the absence of clear Fibonacci retracement levels, the market's direction could hinge on these nuanced signals, all while the lack of distinct chart patterns keeps traders on high alert, awaiting new developments.
Anticipate three scenarios in the coming weeks: a bullish breakout if WMT surpasses the $118.61 resistance with robust volume support, a potential bearish slide below $117.14 if sellers regain control, or a continued consolidation, where the stock meanders between critical levels, biding its time for a decisive push. Each scenario is laden with probabilities—40% bullish, 30% bearish, and 30% neutral—setting the stage for strategic plays.
For those ready to engage in tactical maneuvers, consider entering positions in the $117.00 to $117.50 range, with a stop loss at $115.50 to guard against downside risks. With take profit targets at $119.00 and $121.00, the risk/reward ratio remains an enticing 1:2.3, offering a calculated play for those willing to navigate the uncertainties.
Key risk factors include a potential slowdown in consumer spending, persistent inflationary pressures, and ever-looming competition from rivals such as Amazon. Each could alter the course of WMT's performance, underscoring the importance of vigilant market watch.
The bottom line? It's a "hold" for now. With crucial levels in play and the market's broader tone set for bullish opportunities, the next few days are pivotal for WMT. Traders and investors alike should keep their strategies sharp and their analytics tools at the ready.
Key Takeaways:
- WMT's resistance at $118.61 is the immediate hurdle.
- Support levels to watch are $117.14 and $115.50.
- RSI neutral at 58.17; MACD suggests weakening bullish momentum.
- No clear Fibonacci levels; signals await confirmation.
- Bullish scenario probability at 40%, bearish at 30%.
- Entry point between $117.00-$117.50; stop loss at $115.50.
- Take profit targets at $119.00 and $121.00.
- Risk/Reward stands at 1:2.3.
- Macro conditions support a potential rise in consumer spending.
FINAL VERDICT
| Decision | Value |
|---|---|
| ACTION | HOLD |
| Confidence Level | 70% |
| Entry Price | $117.00 |
| Stop Loss | $115.50 |
| Take Profit | $119.00 |
| Risk/Reward | 1:2.3 |
| Success Probability | 40% (based on technical setup strength) |
| Timeframe | 1-2 weeks |
WHY THIS TRADE: Given the market's bullish undertones and WMT's technical setup, holding with cautious optimism is recommended. The stock's near-resistance levels and neutral RSI suggest a potential upside if it breaks crucial resistance.
WHAT MUST HAPPEN: A clear break above $118.61 with significant volume would validate the bullish thesis and signal a potential breakout.
FAQ
Sources:
- The Motley Fool: "This Stock Could Benefit From a Major Industry Shift Over the Next Decade" Read more
GET AN EDGE WITH AI ANALYSIS
Tired of missing big moves? InteractiveCrypto Pro uses artificial intelligence to analyze stocks and crypto 24/7.
What you get:
- AI-Powered Signals with 94% historical accuracy
- Real-time Fair Value estimates
- 40+ technical indicators analyzed automatically
- Instant alerts when key levels are hit
LIMITED TIME: 50% OFF - Plans from just $6.49/month
Start Your Free Analysis Now →
Ready to Trade WMT Like a Pro?
InteractiveCrypto Pro gives you the edge with:
- AI-Powered Signals - 94% accuracy
- Real-time Fair Value Estimates
- 40+ Technical Indicators
- Instant alerts on key levels
50% OFF - Just $6.49/month
Compare Your Options:
Compare trading platforms to find the best tools for your strategy.


COMMENTS (0)