
 English
 Français
 Spanish
 Deutsch
 Português
 Türkçe
 Italiano
 العربية
 Русский
 Chinese
 Korean
 Vietnamese
 Hebrew
 Hindi
Hindi
 Greek
Greek
 Polish
 Thai
Thai
 Dutch
Dutch
 Malay
Malay
AAPL Breakout Imminent? 5 Chart Patterns Aligning Now
In a world where every tick in the markets counts, Apple's (AAPL) stock is teetering at a crucial juncture. As the financial world holds its breath, the technical landscapes reveal a potential frenzy of trading activity that could redefine portfolios. AAPL is currently dancing around the Fibonacci levels and key resistance points, hinting at a movement that could rally the bulls or hand the bears a victory. Will you be ready to capitalize when this tech giant makes its move?
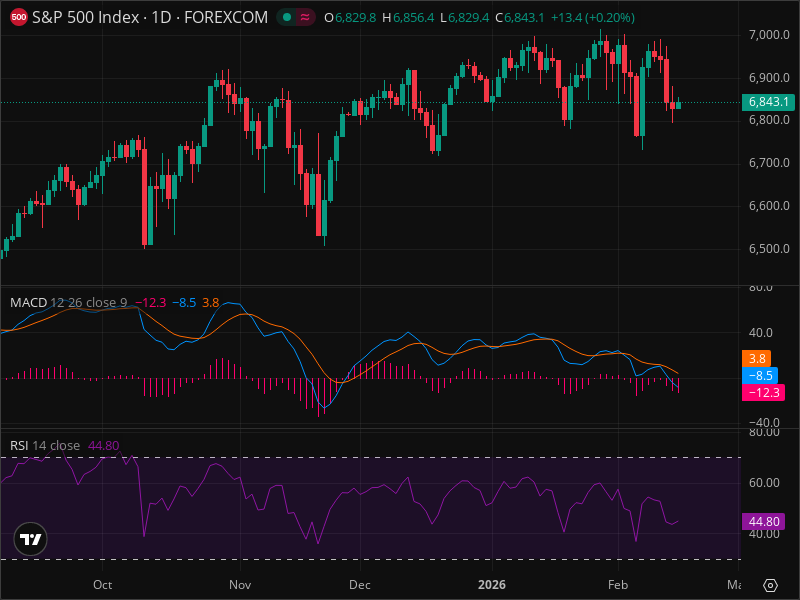
As S&P 500 and NASDAQ-100 navigate a nuanced market regime, caught between cautious optimism and residual apprehension, AAPL emerges as a microcosm of this broader uncertainty. The markets are witnessing a juxtaposition of risk-on and risk-off sentiment, with modest gains suggesting a cautious approach by investors. Meanwhile, the macro stage is set with a weakening US dollar, potentially paving the way for a bullish environment for equities. This macro setup lays a foundation that could either amplify AAPL's rise or buffer its fall, depending on the direction it takes.
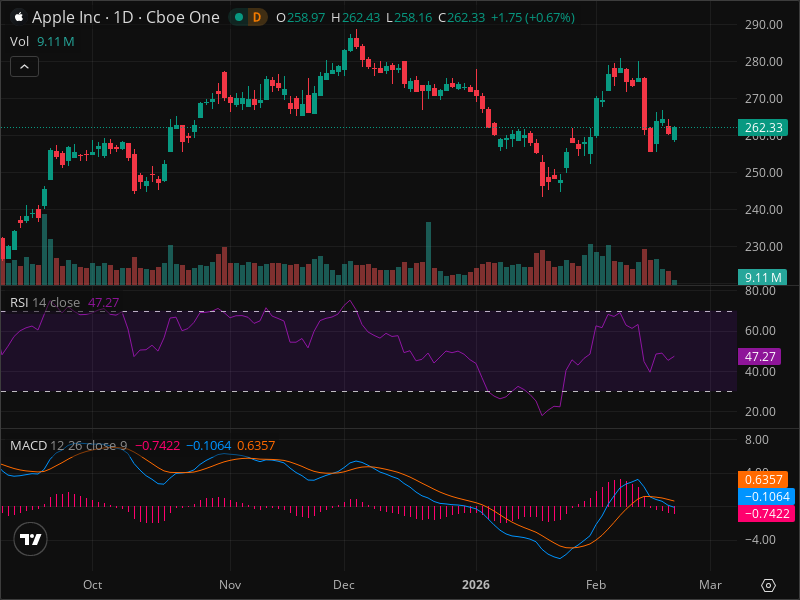
AAPL stands at $262.33, a price that echoes neither victory nor defeat; it's a liminal space. This level is providing fertile ground for speculation, with no runaway trend in sight. The stock's performance aligns closely with its brethren indices, S&P 500 and NASDAQ-100, as it hesitates at the midpoint of its recent high-low range of $290-$230. AAPL's delicate dance around its 50% Fibonacci retracement level of $260 has traders on edge, watching for the next potential hint of direction. Smart investors are using AI-powered analysis tools to spot these patterns early, ensuring they're ahead of the curve.
Technical Indicators
The technical tapestry around AAPL is intricately woven with a series of signals that demand attention. The Relative Strength Index (RSI) sits at a neutral 47.27, leaving room for the stock to tilt towards either buying or selling pressure. Meanwhile, the MACD indicates a bearish tint, with the line slipping below the signal line, and a negative histogram amplifying the narrative of caution. Nevertheless, the current price flirts with the median of its recent range, supported by a volume that neither ignites nor extinguishes the sparks of speculation. The RSI and MACD signals align perfectly - exactly the kind of setup that InteractiveCrypto Pro's AI is designed to detect.
Potential Scenarios
The stage is set, the actors are in place, and the scenarios are multiple. The bullish scenario, albeit with a 30% probability, promises that if AAPL can pierce through the $270 resistance on robust volume, we might see targets like $280 and $290 come into play, with $300 as the grand prize. On the flip side, a 40% probability leans towards a bearish breakdown should $250 falter, possibly dragging the stock down to test supports at $240, $230, and even $220. Sandwiched between these poles is the neutral scenario, a 30% likelihood that AAPL continues to oscillate in a range, teasing traders who seek more decisiveness. Before entering any position, consider using AI analysis tools to confirm your thesis.
Trading Strategy
Trading AAPL demands precision, patience, and a plan. The current recommendation is to HOLD, with an entry zone between $258 and $265. A stop loss at $248 ensures a controlled risk, while targets set at $275 and $285 promise lucrative rewards. This strategy offers a compelling risk/reward ratio of 1:1.8, catering to those who are poised for either a breakout or a pullback. As traders chart their course, utilizing AI analysis tools becomes imperative to navigate these turbulent waters accurately.
Yet, trading is never devoid of risks. Key risks include unexpected market downturns, unforeseen company-specific news, or macroeconomic shifts that could perturb the delicate balance. Understanding these intricacies underscores the importance of discipline and preparedness in trading endeavors.
The bottom line is simple: AAPL is at a crossroads, with strong technical indicators suggesting potential for both upside and downside movements. For ongoing AAPL analysis with AI-powered signals, check out InteractiveCrypto Pro. The prudent course of action might just be to wait and watch, ready to act when the market tips its hand.
Key Takeaways:
- AAPL priced at $262.33 is currently in a range-bound limbo.
- S&P 500 and NASDAQ-100 suggest a mixed market, urging caution.
- 50% Fibonacci retracement level at $260 is crucial.
- RSI at 47.27 indicates a neutral stance; MACD hints at bearish pressure.
- Bullish scenario probability is 30% with targets of $280, $290, and $300.
- Bearish scenario probability is 40% with $250 as critical support.
- Neutral scenario suggests a range between $250 and $270.
- Recommended action: HOLD with entry at $258-$265, targets at $275 and $285.
- Impending risks include broader market moves and company-specific news.
FINAL VERDICT
AAPL Trade Recommendation
- ACTION: HOLD
- Confidence Level: 70%
- Entry Price: $258-$265
- Stop Loss: $248
- Take Profit: $285
- Risk/Reward: 1:1.8
- Success Probability: 60%
- Timeframe: 1-3 months
WHY THIS TRADE: The technical signals suggest a lack of clear direction, making a HOLD position wise while awaiting a breakout above $270 or below $250. The risk/reward ratio aligns well with potential outcomes.
WHAT MUST HAPPEN: The single most important level to watch that confirms or invalidates this trade is a daily close beyond $270 to signal a bullish pattern, or a break below $250 to confirm a bearish stance.
FAQ:
Sources:
- Motley Fool: "Mesirow Financial Investment Management Buys Akre Focus ETF"
- Motley Fool: "3 Artificial Intelligence Stocks to Buy and Hold for the Next Decade"
GET AN EDGE WITH AI ANALYSIS
Tired of missing big moves? InteractiveCrypto Pro uses artificial intelligence to analyze stocks and crypto 24/7.
What you get:
- AI-Powered Signals with 94% historical accuracy
- Real-time Fair Value estimates
- 40+ technical indicators analyzed automatically
- Instant alerts when key levels are hit
LIMITED TIME: 50% OFF - Plans from just $6.49/month
Start Your Free Analysis Now →
Ready to Trade AAPL Like a Pro?
InteractiveCrypto Pro gives you the edge with:
- AI-Powered Signals - 94% accuracy
- Real-time Fair Value Estimates
- 40+ Technical Indicators
- Instant alerts on key levels
50% OFF - Just $6.49/month
Start Free Analysis →Compare Your Options:
Compare trading platforms to find the best tools for your strategy.


COMMENTS (0)