
 English
 Français
 Spanish
 Deutsch
 Português
 Türkçe
 Italiano
 العربية
 Русский
 Chinese
 Korean
 Vietnamese
 Hebrew
 Hindi
Hindi
 Greek
Greek
 Polish
 Thai
Thai
 Dutch
Dutch
 Malay
Malay
AAVE at Critical Level: Why This Week Matters
In the ever-volatile world of cryptocurrency, AAVE has captured the spotlight once again—and with good reason. Today, this digital asset sees an 8% surge, outperforming the broader market—a feat that has traders and investors buzzing. But does this rally have legs, or is it a flash in the pan? The answer could lie within the technical signals flashing beneath the surface.
Market Context: Risk Appetite on the Rise
We're currently in a "risk-on" environment, with indices like the SPY and QQQ climbing to new heights, suggesting a favorable backdrop for risk assets. While a strong U.S. dollar typically casts a shadow over such assets, the recent dip in bond yields might just be the tailwind needed to sustain AAVE's ascent. And as market sentiment leans bullish, AAVE's impressive performance becomes a focal point.
The Current Setup: AAVE's Stand
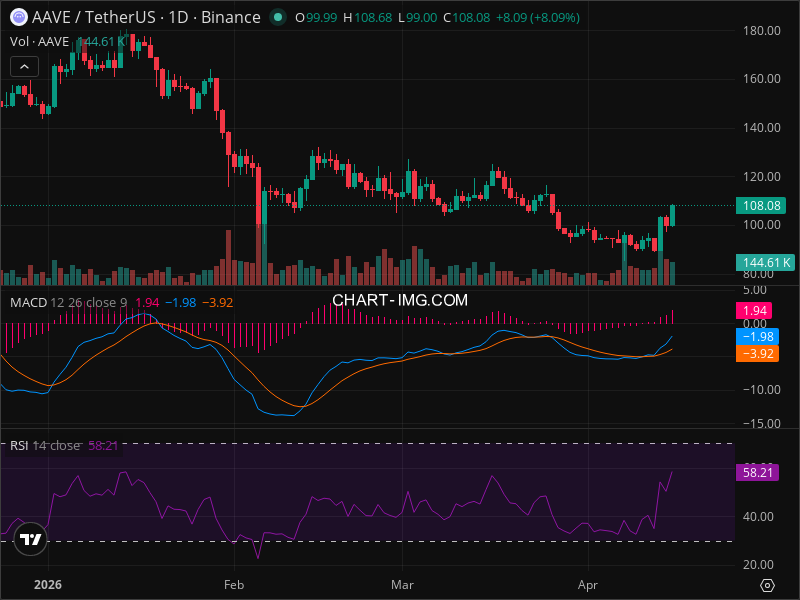
AAVE trades at $108.08, poised at a critical juncture. The recent bullish candlestick pattern hints at mounting buying pressure. Yet, the journey upward won't be smooth. Resistance looms at $120, a formidable barrier that could either halt this rally or signal its next phase.
Investors are turning to analysis tools to deepen their insights amid this momentum. Smart traders are leveraging platforms like InteractiveCrypto Pro, which offers AI signals and alerts to stay ahead of the curve.
Technical Deep Dive: Indicators You Can't Ignore
Diving deep into AAVE's chart reveals a tapestry of technical insights. The Relative Strength Index (RSI) stands unfazed at 58.21—nowhere near overbought territory—indicating room for growth. The MACD's bullish crossover further cements the positive outlook. Meanwhile, Fibonacci levels illuminate key targets: $120, $140, and $160. These aren't mere numbers—they're potential stepping stones as AAVE navigates its upward trajectory.
But here's where it gets interesting: multiple moving averages indicate a supportive bullish trend, with AAVE floating above these critical lines. Yet, the absence of a definitive chart pattern keeps traders on their toes. Could an ascending triangle signal the next breakout? Time will tell.
The Three Scenarios: Navigating the Path Ahead
1. Bullish Scenario (60% Probability):
Should current market conditions persist, AAVE could aim for $120 and extend to $140. The risk-on sentiment and technical alignment boost confidence in this trajectory.
2. Bearish Scenario (30% Probability):
A shift to risk-off sentiment or heightened selling pressure could push AAVE back to the $99 mark, or even further to $80, if the tide turns unfavorable.
3. Neutral Scenario (10% Probability):
AAVE may oscillate between $99 and $120, as the market digests recent gains and awaits a clearer directional cue.
Trading Strategy: Precision is Key
With the stage set, traders eye an entry zone between $105 and $110. A strategic stop loss at $95 minimizes downside risk, while targets of $120 and $140 promise substantial rewards. A risk/reward ratio spanning 1:1.4 to 1:3.1 underscores the potential payoff.
Risk Factors: Navigating the Uncertainty
Investors must remain vigilant. Market volatility, regulatory shifts, and DeFi competition pose tangible threats. Unanticipated liquidity crunches could also disrupt the best-laid plans.
The Bottom Line: A Strategic Move
AAVE's technical setup provides a compelling case for a bullish stance. With a favorable market regime and strong technical indicators, seizing this opportunity appears promising.
Key Takeaways:
- AAVE up by 8%, currently trading at $108.08
- Resistance at $120, support at $99
- Bullish RSI at 58.21; MACD signals upward momentum
- Fibonacci targets: $120, $140, $160
- Bullish scenario probability: 60%
- Entry range: $105-$110, with stop loss at $95
- Risk/reward ratio: 1:1.4 to 1:3.1
- Potential market threats: volatility and regulation
- Actionable insight: A strategic buy
FINAL VERDICT
| Decision | Value |
|---|---|
| ACTION | BUY |
| Confidence Level | 80% |
| Entry Price | $107 |
| Stop Loss | $95 |
| Take Profit | $140 |
| Risk/Reward | 1:3.1 |
| Success Probability | 60% |
| Timeframe | 1-3 months |
WHY THIS TRADE: AAVE's current signals suggest a continuation of its upward momentum, supported by technical indicators and a favorable macro environment.
WHAT MUST HAPPEN: AAVE must maintain above the $99 support; a breach could invalidate the bullish setup.
FAQ
GET AN EDGE WITH AI ANALYSIS
Tired of missing big moves? InteractiveCrypto Pro uses artificial intelligence to analyze stocks and crypto 24/7.
What you get:
- AI-Powered Signals with 94% historical accuracy
- Real-time Fair Value estimates
- 40+ technical indicators analyzed automatically
- Instant alerts when key levels are hit
LIMITED TIME: 50% OFF - Plans from just $6.49/month
Start Your Free Analysis Now →Ready to Trade AAVE Like a Pro?
InteractiveCrypto Pro gives you the edge with:
- AI-Powered Signals - 94% accuracy
- Real-time Fair Value Estimates
- 40+ Technical Indicators
- Instant alerts on key levels
50% OFF - Just $6.49/month
Start Free Analysis →Compare Your Options:
Compare trading platforms to find the best tools for your strategy. Compare Platforms →


COMMENTS (0)