
 English
 Français
 Spanish
 Deutsch
 Português
 Türkçe
 Italiano
 العربية
 Русский
 Chinese
 Korean
 Vietnamese
 Hebrew
 Hindi
Hindi
 Greek
Greek
 Polish
 Thai
Thai
 Dutch
Dutch
 Malay
Malay
ALGO Warning: Key Support Level Being Tested Right Now
The world of cryptocurrency is rife with opportunities and risks, and one of the digital assets currently at a pivotal crossroads is Algorand (ALGO). As the broader market shows signs of a bullish resurgence, ALGO finds itself in a precarious position. Down 1.32% today despite a risk-on environment, traders and investors alike are wondering: is ALGO about to fall through a critical support level, or is this the calm before a significant upward reversal? In this analysis, we’ll dissect the data and provide insights that could shape your next strategic move.
The cryptocurrency market is notoriously volatile, with sentiment shifting as swiftly as prices do. ALGO is no exception. The stakes are high, and the technical indicators paint a picture that is both intriguing and alarming. While the S&P 500 (SPY) and NASDAQ-100 (QQQ) indices climb, suggesting a preference for riskier assets, ALGO’s lack of upward momentum hints at deeper underlying issues. Let's unravel the situation and explore what the technicals say about ALGO's immediate future.
Market Context
In the grand mosaic of the financial markets, understanding the macroeconomic backdrop is crucial. Currently, the S&P 500 and NASDAQ-100 are experiencing an upswing, a testament to the prevailing risk-on sentiment in the market. Investors are flocking towards equities, buoyed by a softer U.S. dollar and declining bond yields, which traditionally bodes well for risk assets including cryptocurrencies. However, Algorand seems to be marching to a different beat.
Despite this favorable macro environment, ALGO remains in a downward spiral. The disconnect between the broader market rally and ALGO’s price action suggests that internal factors may be at play. While the weak dollar and lower yields typically encourage investment in assets like ALGO, the lack of a corresponding uptick in its price is concerning.
The Current Setup
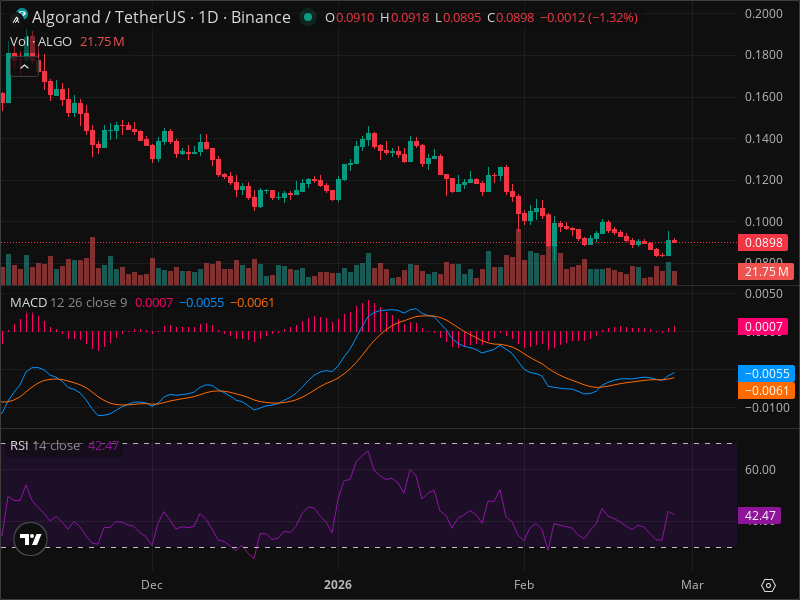
Zooming in on ALGO itself, the current price action is less than inspiring. The asset continues to languish in a downtrend, as evidenced by its daily chart. Recent candles have closed in red, underscoring the persistent bearish pressure. Important levels of resistance loom overhead, with the most immediate at 0.0918 USDT, which ALGO recently failed to surpass. Conversely, the nearest support lies at 0.0895 USDT, a level currently underpinning ALGO's price.
Despite average volume, there’s no significant influx of trading activity to suggest a potential reversal or breakout. The absence of a distinct Fibonacci retracement pattern further complicates the picture, leaving traders without the usual guideposts to navigate these tumultuous waters.
Technical Deep Dive
Delving deeper into the technical indicators, we find a mix of signals that demand close scrutiny:
- Relative Strength Index (RSI): At 42.47, ALGO’s RSI sits in neutral territory, indicating it is neither oversold nor overbought. This neutral reading, however, doesn’t provide a clear direction.
- MACD: The Moving Average Convergence Divergence (MACD) indicator tells a more somber story, with the MACD line below the signal line. This crossover into negative territory signals bearish momentum, reinforced by the negative histogram.
- Support and Resistance Levels: ALGO is currently testing support at 0.0895 USDT. A breach here could see the price plummet to secondary supports at 0.08 USDT and further down to 0.07 USDT, both of which carry moderate significance. On the upside, resistance stands at 0.0918 USDT, with more formidable barriers at 0.10 USDT and 0.12 USDT.
- Chart Patterns: Unfortunately, there are no clear patterns emerging. The absence of definable chart formations leaves traders grappling for a clearer outlook.
Smart investors are using AI analysis tools to spot these patterns early and make informed decisions.
The Three Scenarios
Given the current landscape, three potential scenarios emerge for ALGO:
- Bullish Scenario: Should ALGO decisively break above 0.0918 USDT with increased volume and a subsequent bullish MACD crossover, it could aim for targets at 0.10 USDT and 0.12 USDT. The probability of this scenario playing out in the coming weeks is estimated at 30%.
- Bearish Scenario: A breakdown below 0.0895 USDT, accompanied by increased volume, could trigger a sell-off towards 0.08 USDT and potentially 0.07 USDT. This scenario carries a higher likelihood of 50%, given the prevailing bearish indicators.
- Neutral Scenario: ALGO may continue to range between 0.0895 USDT and 0.0918 USDT for several days. The probability of this range-bound action is pegged at 20%.
Want real-time alerts when ALGO hits these levels? InteractiveCrypto Pro monitors 40+ indicators automatically.
Trading Strategy
Navigating ALGO’s current price action requires a well-thought-out strategy. Here are the entry and exit points to consider:
- Entry Zone: A cautious entry can be made between 0.089 USDT and 0.092 USDT.
- Stop Loss: To mitigate risks, a stop-loss should be placed at 0.085 USDT, limiting potential losses to 4.5%.
- Take Profit: Targets are set at two levels - 0.10 USDT for an 8.7% reward and 0.12 USDT for a potential 30% reward, translating to risk/reward ratios of 1:2 and 1:6.6, respectively.
Before entering any position, consider using AI analysis tools to confirm your thesis and maximize your chances of success.
Risk Factors
While technical indicators provide guidance, several risks could derail even the best-laid plans:
- Market Reversal: A sudden market downturn impacting risk assets could pose significant risks.
- ALGO-Specific Events: Any negative news specific to Algorand could exacerbate price declines.
- Volatility: Cryptocurrency markets are inherently volatile; thus, setting a stop-loss is crucial to protect against unforeseen volatility spikes.
The Bottom Line
For ongoing ALGO analysis with AI-powered signals, check out InteractiveCrypto Pro. In conclusion, while ALGO’s immediate future appears precarious, there remain opportunities for the savvy trader. The current technical setup suggests caution, but also the potential for profit, particularly if ALGO manages to swing above resistance levels.
Key Takeaways
- ALGO down 1.32% today despite broader market strength.
- Immediate support at 0.0895 USDT is critical; a break may lead to 0.08 USDT.
- RSI at 42.47 indicates a neutral sentiment.
- MACD crossover suggests continued bearish pressure.
- Bullish scenario has a 30% probability; bearish scenario 50%.
- Entry at 0.089-0.092 USDT; stop-loss at 0.085 USDT.
- Take profits at 0.10 USDT (8.7% gain) and 0.12 USDT (30% gain).
- Risk/reward ratio of 1:2 and 1:6.6.
- Key risk: Market volatility and ALGO-specific news.
FINAL VERDICT
FINAL VERDICT
| Decision | Value |
|---|---|
| ACTION | HOLD |
| Confidence Level | 60% |
| Entry Price | $0.090 |
| Stop Loss | $0.085 |
| Take Profit | $0.10 / $0.12 |
| Risk/Reward | 1:2 / 1:6.6 |
| Success Probability | 50% |
| Timeframe | 1-2 weeks |
WHY THIS TRADE:
Holding is recommended to observe how ALGO performs at its critical support level. Given the technical indicators, there's potential for a rebound if broader market conditions remain supportive.
WHAT MUST HAPPEN:
Monitoring whether ALGO can hold above 0.0895 USDT is crucial. A close below this level signals a stronger bearish trend.
FAQ
Sources & References
GET AN EDGE WITH AI ANALYSIS
Tired of missing big moves? InteractiveCrypto Pro uses artificial intelligence to analyze stocks and crypto 24/7.
What you get:
- AI-Powered Signals with 94% historical accuracy
- Real-time Fair Value estimates
- 40+ technical indicators analyzed automatically
- Instant alerts when key levels are hit
LIMITED TIME: 50% OFF - Plans from just $6.49/month
Start Your Free Analysis Now →
Ready to Trade ALGO Like a Pro?
InteractiveCrypto Pro gives you the edge with:
- AI-Powered Signals - 94% accuracy
- Real-time Fair Value Estimates
- 40+ Technical Indicators
- Instant alerts on key levels
50% OFF - Just $6.49/month
Start Free Analysis →Compare Your Options:
Compare trading platforms to find the best tools for your strategy.


COMMENTS (0)