
 English
 Français
 Spanish
 Deutsch
 Português
 Türkçe
 Italiano
 العربية
 Русский
 Chinese
 Korean
 Vietnamese
 Hebrew
 Hindi
Hindi
 Greek
Greek
 Polish
 Thai
Thai
 Dutch
Dutch
 Malay
Malay
AVGO at Critical Level: Why This Week Matters
In a market teetering on the edge of volatility, Broadcom Inc. (AVGO) stands at a pivotal juncture. With market darlings like SPY and QQQ rallying, the question on every investor's mind is whether AVGO can break free from its current range or plummet to new depths. The stakes have never been higher, and traders must act with precision. But here's where it gets interesting: A confluence of technical indicators suggests a seismic shift is imminent.
AVGO isn't just another stock. It’s a bellwether for the tech sector, a sector currently under the gravitational forces of a weakening dollar and sliding bond yields. These macroeconomic elements create a fertile ground for equities, especially multi-national giants like Broadcom, to thrive by boosting their revenues overseas and making stocks a more attractive investment than bonds.
At a time when AI-driven analysis tools are gaining traction among savvy investors, being able to spot these opportunities early could be the difference between profit and loss. One such tool, InteractiveCrypto Pro, offers a cutting-edge edge. As the market embraces risk-on sentiment, AVGO's trajectory becomes a lightning rod for speculation.
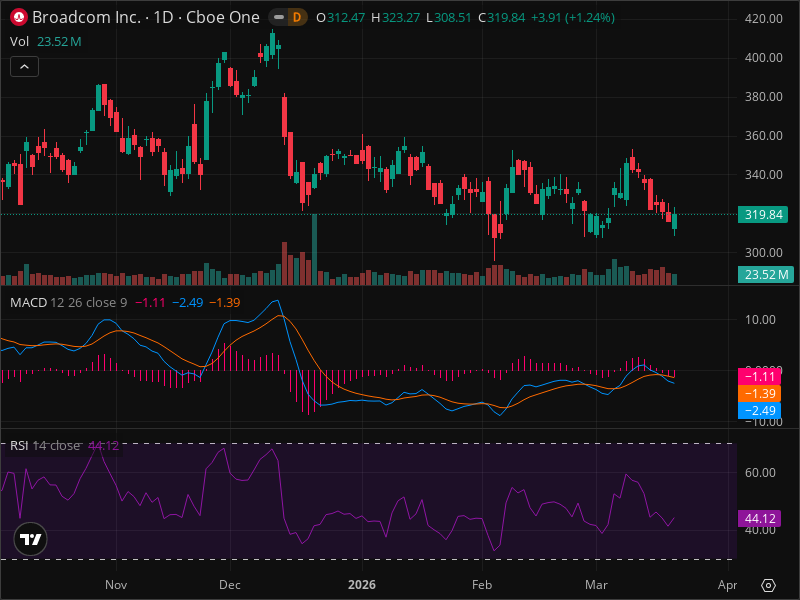
Broadcom's current setup reveals a stock in flux, hovering around $319.84, sandwiched between critical support at $308 and resistance near $340. The stock's recent price action typifies slight upward momentum, though it lags behind the broader tech rally led by SPY and QQQ. Its performance neither outpaces nor falls behind, suggesting a period of consolidation before a decisive move.
Technically, the stock is facing immediate resistance at $340, a level marked by previous lows, with higher resistance at $360 and an apex of $420, where it last peaked. Support levels loom at $308, $300, and an ultimate fallback at $280. These levels are vital signposts for traders hedging their bets on where AVGO might head next.
But perhaps most telling are the signals from our technical indicators. The Relative Strength Index (RSI) sits in neutral territory at 44.12, neither overbought nor oversold, providing no clear bias. Meanwhile, the Moving Average Convergence Divergence (MACD) reveals a bearish crossover, with the MACD line dipping below the signal line, complemented by a negative histogram—indicating potential downward pressure. These signals are what InteractiveCrypto Pro's AI is designed to detect, enabling traders to make informed decisions.
Fibonacci retracement levels further complicate the narrative. Currently below the 23.6% retracement at $345, AVGO searches for support. The 38.2% retracement rests at $365, the 50% at $385, and 61.8% at $400. These levels signify potential reversal points or areas of strong support and resistance, vital for crafting effective trading strategies.
Potential Scenarios
In this complex landscape, three potential scenarios unfold for AVGO:
- Bullish Scenario: Should the market's risk-on appetite continue unabated, AVGO may target $340 and $360, with a 35% probability over the next three months.
- Bearish Scenario: Conversely, a shift towards risk-off sentiment or adverse news could see AVGO testing supports at $308 and $300, with a 40% likelihood.
- Neutral Scenario: The stock could remain range-bound between $308 and $340, a 25% chance over the coming months.
Each scenario underlines the importance of strategic entry and exit points. Traders are advised to hold positions, entering near current levels around $319.84, with a stop loss at $305 to mitigate risks, and profit targets at $340 and $360, reflecting a risk/reward ratio ranging from 1:1.2 to 1:2.4.
Yet, like any investment, AVGO is not without its risks. Changes in market sentiment, regulatory shifts in the semiconductor industry, emerging competitors, and even a slowdown in AI could derail current predictions. Economic slowdowns, supply chain disruptions, and geopolitical tensions further compound these risks. Investors should limit AVGO exposure to 1-2% of their total portfolio.
So what’s the bottom line? Given the current technical setup, a hold recommendation emerges as the strategic choice for AVGO, with an eye on fluctuating market conditions. But for those seeking more precise, data-driven insights, InteractiveCrypto Pro provides a critical edge.
Key Takeaways
- AVGO is currently trading at $319.84, with resistance at $340 and support at $308.
- RSI is neutral at 44.12, while MACD signals bearish tendencies.
- Fibonacci retracement levels place resistance from $345 to $400.
- Bullish scenario targets $340-$360, bearish $308-$300, with probabilities of 35% and 40%, respectively.
- Hold strategy with a stop loss at $305, profit targets at $340 and $360.
- Market risk factors include regulatory, competitive, and macroeconomic changes.
- AVGO position should constitute 1-2% of a diversified portfolio.
FINAL VERDICT
Actionable Recommendation:
- ACTION: HOLD
- Confidence Level: 55%
- Entry Price: $319.84
- Stop Loss: $305
- Take Profit: $340 / $360
- Risk/Reward: 1:1.2 to 1:2.4
- Success Probability: 55%
- Timeframe: 1-3 months
WHY THIS TRADE: The hold position allows traders to ride out potential upward movements while mitigating risk through a strategic stop loss. Technical signals, like the MACD and RSI, suggest caution, but also potential for upside within a defined range.
WHAT MUST HAPPEN: The single most important level to watch that confirms or invalidates this trade will be a daily close below $305, which would necessitate reassessing the current strategy.
FAQ
Sources
- Motley Fool: "What if ASML Becomes the Next Trillion-Dollar Stock?" - Read more
- Motley Fool: "Should You Forget Nvidia and Buy These 2 Artificial Intelligence (AI) Stocks Instead?" - Read more
Ready to Trade AVGO Like a Pro?
InteractiveCrypto Pro gives you the edge with:
- AI-Powered Signals - 94% accuracy
- Real-time Fair Value Estimates
- 40+ Technical Indicators
- Instant alerts on key levels
50% OFF - Just $6.49/month
Start Free Analysis →Compare Your Options:
Compare trading platforms to find the best tools for your strategy.
Compare Platforms →


COMMENTS (0)