
 English
 Français
 Spanish
 Deutsch
 Português
 Türkçe
 Italiano
 العربية
 Русский
 Chinese
 Korean
 Vietnamese
 Hebrew
 Hindi
Hindi
 Greek
Greek
 Polish
 Thai
Thai
 Dutch
Dutch
 Malay
Malay
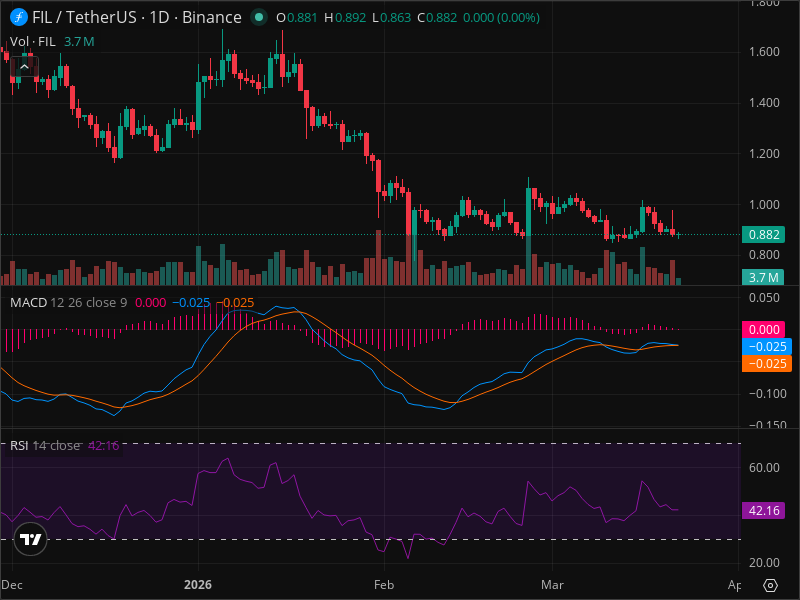
FIL's Pullback Creates Rare Entry Point - Technical Analysis
In the fast-paced world of cryptocurrency trading, timing is everything. FIL, the native token of the Filecoin network, has captured traders' attention as it hovers at a critical junction. With global markets in a state of flux and FIL's technical indicators sending mixed signals, the coming weeks could define the token's trajectory for months to come. Why is this moment so pivotal? Let's delve deeper.
The current financial landscape resembles a battlefield where caution reigns supreme. Major indices like SPY and QQQ are experiencing a downturn, the US dollar is gaining strength, and bond yields are on the rise, signaling a risk-off market sentiment. This backdrop does not favor risk assets like cryptocurrencies, and FIL is no exception. Yet, beneath this turbulent macro environment, lies potential opportunity—the kind that astute traders are trained to spot.
But here's where it gets interesting. FIL's price, currently around $0.882, finds itself amidst a downturn, mirroring the broader market’s unease. The recent convergence of macroeconomic factors has pressured the token, with a robust dollar and rising bond yields leading to decreased demand for risk-heavy assets like FIL. The chart patterns whisper tales of a descending trend, where support and resistance levels dictate the daily dance of price action.
Technical Setup
Let's dig into FIL's technical setup. Presently, the token is locked in a downtrend, although recent price movements hint at consolidation. The price has been oscillating around its latest low of $0.863, while the resistance looms at $0.90 and higher levels like $1.00 and $1.20. These levels are more than mere numbers—they're psychological markers laden with trading history and potential energy.
Smart investors are using AI-powered analysis tools to spot these patterns early. InteractiveCrypto Pro is one such trading platform, allowing traders to harness AI’s precision in real-time, giving them an edge.
Key Indicators
Now, let's break down these technical indicators. The RSI stands at 42.16, a neutral zone suggesting neither an overbought nor oversold condition. MACD, however, tells a different story, as it stays below the signal line—a classic bearish sign. And while volume remains low, reducing confidence in any significant moves, the reported Fibonacci retracement levels offer potential checkpoints at $0.94, $0.99, $1.03, and $1.07. Currently, FIL's price sits beneath all these levels, indicating further downside could be possible.
Potential Scenarios
Analyzing the scenarios, traders see three potential paths. A bullish surge requires a market-wide risk-on shift and FIL piercing the $0.90 mark with significant volume, targeting $1.00 and eventually $1.20. This upside scenario holds a 30% probability. Conversely, a bearish continuation may unfold if the market's cautious tone persists, especially with a break below the recent $0.86 support, eyeing targets at $0.80 and $0.70 with a 50% likelihood. In the middle, there's a neutral path maintaining a tight range between $0.86 and $0.90, offering a 20% chance over the next few weeks.
Trading Strategy
Before entering any position, consider using AI analysis tools to confirm your thesis. Traders are advised to adopt a SELL stance for now, given the prevailing market conditions. Suggested entry points lie between $0.88 and $0.89, with a stop-loss pegged at $0.92 to manage risks. Targets are strategically set at $0.80 and $0.70, boasting a risk-reward ratio of 1:2.0.
The inherent risks? The usual suspects: macroeconomic surprises, sudden sentiment shifts in the crypto market, and any unforeseen negative headlines specific to FIL.
Want real-time alerts when FIL hits these levels? InteractiveCrypto Pro monitors 40+ indicators automatically, guiding traders with AI-backed precision.
In sum, while FIL’s current technical indicators suggest caution, they also highlight the potential for informed, strategic entry points. For ongoing FIL analysis with AI-powered signals, check out InteractiveCrypto Pro.
Key Takeaways:
- FIL is currently priced around $0.882 with a bearish trend.
- SPY, QQQ downturn and strong USD create risk-off conditions.
- RSI neutral at 42.16; MACD and volume suggest bearishness.
- Fibonacci levels: $0.94, $0.99, $1.03, $1.07.
- Support levels: $0.86, $0.80, $0.70; Resistance at $0.90, $1.00, $1.20.
- Bullish scenario: 30% chance; Bearish: 50%, Neutral: 20%.
- Recommended action: SELL with entry at $0.88-$0.89, stop-loss at $0.92.
- Utilize AI like InteractiveCrypto Pro for real-time analysis.
FINAL VERDICT:
| Decision | Value |
|---|---|
| ACTION | SELL |
| Confidence Level | 65% |
| Entry Price | $0.88 |
| Stop Loss | $0.92 |
| Take Profit | $0.80 |
| Risk/Reward | 1:2.0 |
| Success Probability | 50% |
| Timeframe | 1-2 weeks |
WHY THIS TRADE: The current technical indicators, macroeconomic environment, and failing support levels align to suggest further downside. This trade is reinforced by the broader bearish market sentiment and FIL's specific technical weaknesses.
WHAT MUST HAPPEN: A breach below $0.86 would confirm the bearish scenario, further strengthening the case for the SELL recommendation.
FAQ:
Sources:
- Source Name: "Market Analysis - SPY, QQQ Trends" - Read more
- Source Name: "Crypto Technical Analysis Insights" - Read more
GET AN EDGE WITH AI ANALYSIS
Tired of missing big moves? InteractiveCrypto Pro uses artificial intelligence to analyze stocks and crypto 24/7.
What you get:
- AI-Powered Signals with 94% historical accuracy
- Real-time Fair Value estimates
- 40+ technical indicators analyzed automatically
- Instant alerts when key levels are hit
LIMITED TIME: 50% OFF - Plans from just $6.49/month


COMMENTS (0)