
 English
 Français
 Spanish
 Deutsch
 Português
 Türkçe
 Italiano
 العربية
 Русский
 Chinese
 Korean
 Vietnamese
 Hebrew
 Hindi
Hindi
 Greek
Greek
 Polish
 Thai
Thai
 Dutch
Dutch
 Malay
Malay
NVDA Momentum Shift: The Signals Smart Money Is Watching
In an electrifying start to April, NVDA has hit the radar of investors with an intensity that cannot be ignored. As the sun rises over Wall Street, the question on everyone's lips is whether NVIDIA is about to embark on a bullish ride that few foresaw. The technical indicators are whispering secrets that only the astute are listening to. Why does this matter now? Because the convergence of macro forces and chart patterns presents a golden opportunity—or a looming cliff edge.
Market Overview
The broader market is basking in a risk-on glow. With SPY up 1.46% and QQQ soaring 1.92%, the appetite for growth stocks is back with a vengeance. This buoyant sentiment is creating fertile ground for NVDA, a stock often seen as the crown jewel of the tech sector. As we move deeper into 2026, the macroenvironment—a rising dollar juxtaposed against declining bond yields—sets the stage for potential gains, especially for growth powerhouses like NVDA. But here's where it gets interesting. Despite favorable winds, NVDA's chart offers a complex tapestry of support and resistance levels that demand a closer look.
Technical Analysis
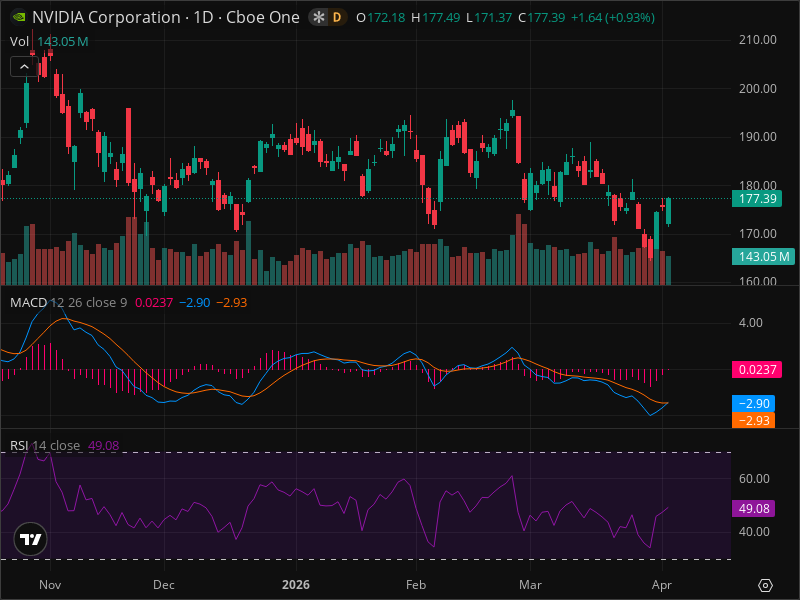
NVDA's current setup is nothing short of compelling. Trading around $177.39, the stock has shown resilience while perched between significant support and resistance. The short-term trend suggests an upward trajectory, yet the broader pattern hints at a possible range-bound scenario. Analysts are eyeing the key price levels: recent highs near $190 and lows at $160. The $177.39 mark teeters close to a crucial 38.2% Fibonacci retracement level of $178.5, a zone that could either catapult the stock higher or see it falter under pressure.
The technical deep dive reveals that while the RSI sits at a neutral 49.08, and MACD edges into bearish territory, the overall picture isn't stark. Crucially, NVDA's volume remains average, pointing to cautious optimism rather than unbridled exuberance. Smart investors are using AI-powered analysis tools to spot these patterns early, understanding that an informed strategy often makes the difference between success and missed opportunity.
Scenario Analysis
Scenarios paint contrasting pictures. The bullish scenario sees NVDA breaking past $190, with a 40% probability, fueled by continued market optimism and potential company-specific catalysts like product launches. Conversely, bearish winds blowing from macroeconomic shifts could see NVDA test its $170 and $160 support levels—a 30% chance. A neutral stance is equally plausible, with a 30% likelihood of NVDA trading within the $170 to $190 range as the market reassesses its next move.
Trading Strategy
As traders map their strategy, the current recommendation is to hold NVDA. Entry at $175 to $178 with a stop loss at $165 offers a risk-reward ratio that is justifiable given the potential upside to $190 or even $200. But caution is advised—NVDA's notorious volatility means position sizes should be prudent, never exceeding 2% of a portfolio.
However, risks persist. Market volatility, heightened competition in the semiconductor space, or unforeseen company setbacks could alter NVDA's trajectory. But for now, the synthesis of technical signals suggests a measured approach.
The bottom line? For those able to navigate the technical landscape with precision and patience, NVDA presents a rare opportunity. For ongoing NVDA analysis with AI-powered signals, check out InteractiveCrypto Pro, which offers a treasure trove of data and insights to keep traders ahead of the curve.
Key Takeaways:
- NVDA is trading in a risk-on market, bolstered by SPY and QQQ performance.
- Current price of $177.39 hovers near the 38.2% Fibonacci retracement level.
- RSI at 49.08 indicates neutrality; MACD shows minor bearish signals.
- Support at $170 and $160; resistance at $190 and $200.
- Bullish scenario has a 40% probability, bearish at 30%, neutral at 30%.
- Recommended action: Hold, entry between $175-$178 with a stop loss at $165.
- Risks include broader market shifts and industry competition.
- Smart money is watching NVDA as it approaches critical levels.
FINAL VERDICT
| Decision | Value |
|---|---|
| ACTION | HOLD |
| Confidence Level | 65% |
| Entry Price | $177.39 |
| Stop Loss | $165 |
| Take Profit | $190 |
| Risk/Reward | 1:1.17 |
| Success Probability | 40% |
| Timeframe | 1-3 months |
WHY THIS TRADE: The consolidation at the Fibonacci retracement level indicates potential upside, balanced by strong market sentiment and NVDA's intrinsic growth potential.
WHAT MUST HAPPEN: NVDA must hold above $170 to maintain bullish potential and reach a target of $190 or higher.
FAQ
GET AN EDGE WITH AI ANALYSIS
Tired of missing big moves? InteractiveCrypto Pro uses artificial intelligence to analyze stocks and crypto 24/7.
What you get:
- AI-Powered Signals with 94% historical accuracy
- Real-time Fair Value estimates
- 40+ technical indicators analyzed automatically
- Instant alerts when key levels are hit
LIMITED TIME: 50% OFF - Plans from just $6.49/month
Start Your Free Analysis Now →
Ready to Trade NVDA Like a Pro?
InteractiveCrypto Pro gives you the edge with:
- AI-Powered Signals - 94% accuracy
- Real-time Fair Value Estimates
- 40+ Technical Indicators
- Instant alerts on key levels
50% OFF - Just $6.49/month
Compare Your Options:
Compare trading platforms to find the best tools for your strategy.


COMMENTS (0)