
 English
 Français
 Spanish
 Deutsch
 Português
 Türkçe
 Italiano
 العربية
 Русский
 Chinese
 Korean
 Vietnamese
 Hebrew
 Hindi
Hindi
 Greek
Greek
 Polish
 Thai
Thai
 Dutch
Dutch
 Malay
Malay
SUI Momentum Shift: The Signals Smart Money Is Watching
The cryptocurrency world is buzzing, and SUI is at the center of the storm. As social media lights up with chatter about SUI, the market is holding its breath, waiting to see if this digital asset will rise like a phoenix or sink back into obscurity. But what's truly fueling this surge in attention? Is it mere speculation, or are there solid fundamentals backing this newfound interest? As the charts unfold, they reveal a story of potential, volatility, and opportunity that could redefine portfolios.
With the broader markets in a risk-on mode—SPY and QQQ both climbing—SUI stands poised for a significant move. The macroeconomic backdrop is favorable for risk assets, with a weakening dollar and rising bond yields creating a fertile ground for cryptocurrencies. However, despite the bullish climate enveloping the market, SUI's recent performance has been lukewarm at best, underperforming its peers and moving sideways. Yet, this could change as the asset hovers near critical support and resistance levels.
Current Setup
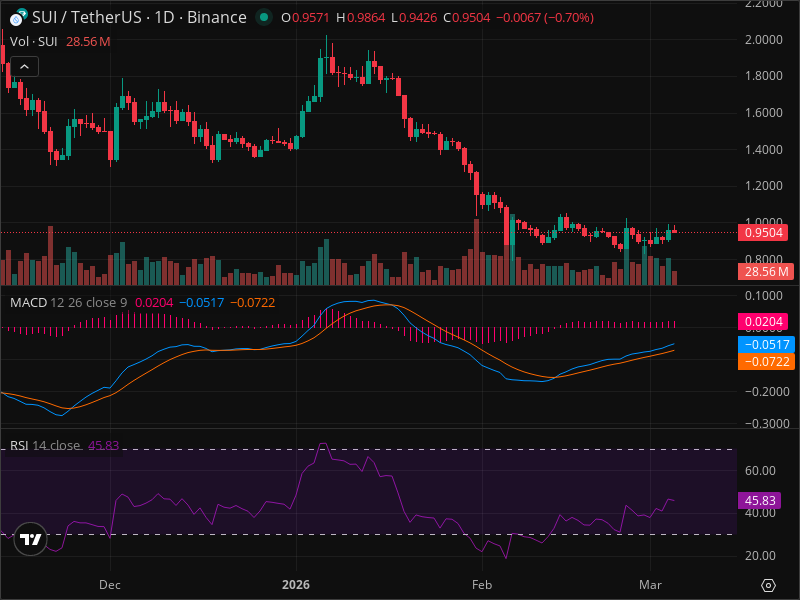
The current setup for SUI shows it trading around $0.95, caught in a tug-of-war between bears and bulls. The narrative unfolds against a backdrop of horizontal short-term trends and a long-term downtrend. Price action, though relatively muted, hints at underlying currents ready to burst into a new phase. The lack of distinct candlestick patterns and average volume suggests a wait-and-see approach, but the pieces are aligning for a potential breakout.
Technical Analysis
Delving into the technical analysis reveals a landscape dotted with crucial indicators. Fibonacci retracement levels project key targets at $1.24, $1.40, and $1.56, should SUI break upwards. But for now, the price remains near its lower bounds, with pivotal support at $0.80 and resistance at $1.00 and beyond. The RSI sits at a neutral 45.83, the MACD whispers of a potential reversal, and no clear chart patterns signal an immediate move. Yet, this very uncertainty is where seasoned investors find opportunity.
Scenario Analysis
Scenarios abound in this complex narrative. A bullish breakout, contingent on SUI breaching the $1.00 mark, could propel it to $1.20 and $1.40 within the next quarter, a scenario carrying a 40% probability. Conversely, a bearish turn, should the market sentiment sour or critical support at $0.80 falter, could drag SUI down to $0.70 or even $0.60, albeit with a slightly lower 30% probability. Meanwhile, a neutral scenario sees SUI oscillating between $0.85 and $1.00, offering little excitement but maintaining a 30% likelihood.
Trading Strategy
For traders eager to capitalize on SUI's potential, the strategy is clear: patience and precision. Entering between $0.90 and $0.98 with a stop loss at $0.85 safeguards against downside risk, while targets at $1.10 and $1.20 offer tantalizing rewards. The risk-to-reward ratio stands at an alluring 1:3, making this a proposition worth considering for the bold.
But herein lies the risk—a market turned on its head by shifting sentiments or unforeseen news, underscoring the importance of positioning size and vigilant monitoring. Should SUI close below $0.85, the bullish outlook swiftly turns sour, mandating a reevaluation.
Conclusion
In conclusion, SUI presents a high-stakes game with the potential for substantial returns, provided one navigates the waters with care. The current analysis suggests a calculated hold, watching for signals that confirm or negate our thesis.
Key takeaways:
- The market regime is risk-on, benefiting SUI.
- SUI trades at $0.95, near critical levels.
- Fibonacci targets are $1.24, $1.40, and $1.56.
- RSI is neutral at 45.83, hinting at indecision.
- Bullish scenario at 40% probability, targeting $1.20, $1.40.
- Bearish scenario at 30% probability, targeting $0.70, $0.60.
- Entry strategy between $0.90 and $0.98 with a 1:3 risk/reward ratio.
- Critical stop loss at $0.85.
FINAL VERDICT
| Decision | Value |
|---|---|
| ACTION | HOLD |
| Confidence Level | 65% |
| Entry Price | $0.90 - $0.98 |
| Stop Loss | $0.85 |
| Take Profit | $1.10, $1.20 |
| Risk/Reward | 1:3 |
| Success Probability | 40% |
| Timeframe | 1-3 months |
WHY THIS TRADE: The technical indicators suggest a potential bullish breakout if SUI can hold above $0.85 and breach $1.00. The market backdrop is favorable, but caution is warranted.
WHAT MUST HAPPEN: A daily close above $1.00 would confirm the bullish scenario.
FAQ
Sources & References:
- Investing.com: Golden Cross Alert - Read more
- Motley Fool: Vision Capital Corp's SL Green Realty Exit - Read more
GET AN EDGE WITH AI ANALYSIS
Tired of missing big moves? InteractiveCrypto Pro uses artificial intelligence to analyze stocks and crypto 24/7.
What you get:
- AI-Powered Signals with 94% historical accuracy
- Real-time Fair Value estimates
- 40+ technical indicators analyzed automatically
- Instant alerts when key levels are hit
LIMITED TIME: 50% OFF - Plans from just $6.49/month
Start Your Free Analysis Now →
Ready to Trade SUI Like a Pro?
InteractiveCrypto Pro gives you the edge with:
- AI-Powered Signals - 94% accuracy
- Real-time Fair Value Estimates
- 40+ Technical Indicators
- Instant alerts on key levels
50% OFF - Just $6.49/month
Compare Your Options:
Compare trading platforms to find the best tools for your strategy.


COMMENTS (0)