
 English
 Français
 Spanish
 Deutsch
 Português
 Türkçe
 Italiano
 العربية
 Русский
 Chinese
 Korean
 Vietnamese
 Hebrew
 Hindi
Hindi
 Greek
Greek
 Polish
 Thai
Thai
 Dutch
Dutch
 Malay
Malay
XLK Warning: Key Support Level Being Tested Right Now
As financial markets navigate turbulent waters, the XLK ETF, a cornerstone of technology sector investing, finds itself at a critical juncture. Dropping 2.27% in today's session, the ETF is flirting dangerously close to fundamental support levels that could dictate the immediate future of tech stocks and broader market sentiments.
The drama unfolds as the S&P 500 and NASDAQ-100 also retrace, with SPY and QQQ down 1.21% and 1.52%, respectively. This sets the stage for a tense market environment, where every tick of the chart could herald a broader shift. The technical indicators are flashing urgent signals that demand investor attention.
But here's where it gets interesting: XLK, which tracks major technology companies, is not just mirroring the broader market's risk-off sentiment—it is amplifying it. The U.S. dollar's continued strength and rising bond yields further compound the pressure, creating a perfect storm that could lead to significant volatility.
WHY XLK ETF IS MOVING TODAY
The 2.27% decline in XLK today is not an isolated incident. It reflects the tech-heavy ETF's sensitivity to macroeconomic factors, including a strengthening U.S. dollar and climbing interest rates. This ETF comprises leading technology companies, making it a barometer for sector health. The decline suggests underlying concerns about tech stock valuations and future growth prospects amidst tightening monetary conditions.
This movement may signal a broader trend if key support levels fail to hold, potentially sparking a sector-wide revaluation. Investors should watch the $134 support level closely, as a breach could indicate further downside.
MARKET CONTEXT
The broader market setup, with SPY trading at $648.57 and QQQ at $582.06, paints a picture of a market gripped by uncertainty. A rising Dollar Index, as indicated by the UUP ETF's slight uptick, underscores the risk-off stance prevailing among investors. Simultaneously, the decline in long-term bond prices, with the TLT ETF down 1.13%, suggests a recalibration of interest rate expectations.
The macroeconomic narrative continues to be dominated by inflationary pressures and central bank policies, setting a cautious tone that reverberates through every asset class. For technology stocks, traditionally more sensitive to interest rate changes, this spells heightened volatility.
THE CURRENT SETUP
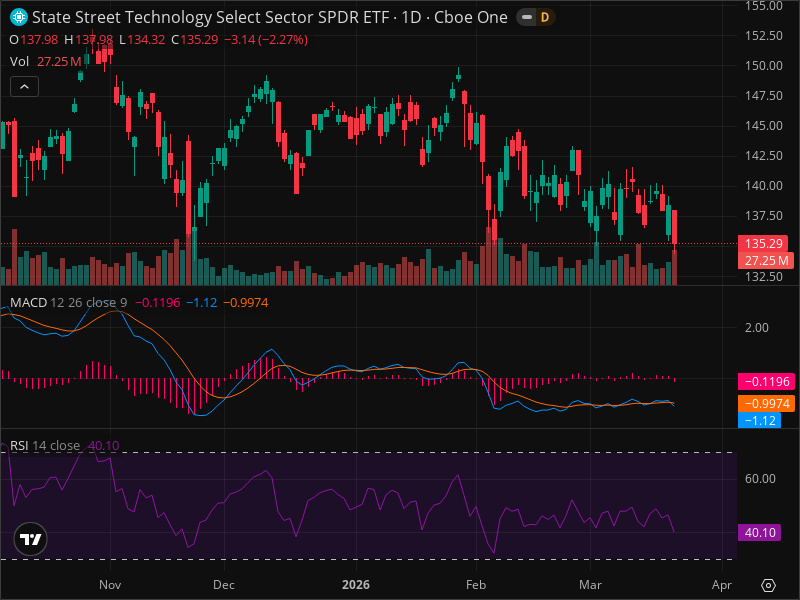
XLK's precipitous drop to $135.29 is a pivotal moment that could redefine its trajectory. The ETF, a proxy for technology sector performance, stands at a crossroads between recovery and further decline. The $134 support level, previously a bastion of bullish resolve, is now being tested as the ETF navigates a bearish short-term trend.
TECHNICAL DEEP DIVE
The technical landscape presents a complex tapestry of resistance and support. Fibonacci analysis from recent highs of $148 to lows of $134 offers critical retracement levels: 23.6% at $137.3, 38.2% at $139.4, and 50% at $141. These levels form potential waypoints for any bullish recovery attempt.
However, the Relative Strength Index (RSI) languishing at 40.10 suggests neither overbought nor oversold conditions, indicating lukewarm momentum. The Moving Average Convergence Divergence (MACD) further adds to the bearish picture, with the MACD line below the signal line and a negative histogram reinforcing selling pressure.
Support levels include S1 at $134, a crucial line in the sand, while resistance mounts at R1 $137.3. The path of least resistance appears downward, unless a significant reversal triggers buying interest.
THE THREE SCENARIOS
Bullish Scenario: Should market conditions stabilize, and interest in tech stocks rebound, XLK could recover to $137.3 or $139.4. This scenario, however, carries only a 25% probability within the next 1-2 weeks.
Bearish Scenario: Continuation of current market weakness could drive XLK down to $130, with a 50% likelihood. The bearish scenario underscores the prevailing market narrative of risk aversion.
Neutral Scenario: A market standoff could see XLK oscillate between $134 and $137.3, with a 25% probability over the coming week.
TRADING STRATEGY
For traders, the recommendation is clear: SELL in the range of $135.29 to $136.00, with a stop loss at $138.00 and two take-profit targets at $134.00 and $130.00. This strategy offers a risk/reward ratio of 1:2.64, favoring those betting on continued market weakness.
RISK FACTORS
The primary risk factors include unexpected shifts in macroeconomic policies or abrupt changes in market sentiment that could render current technical setups obsolete. Investors should also account for sector-specific news that might impact key XLK components.
THE BOTTOM LINE
Given the current technical setup and macroeconomic backdrop, a cautious stance is warranted. For further insights and real-time alerts, savvy investors are turning to AI-powered analysis tools like InteractiveCrypto Pro.
KEY TAKEAWAYS
- XLK down 2.27% amidst broader market weakness.
- Key support at $134 being tested, resistance at $137.3.
- RSI at 40.10 suggests weak momentum.
- MACD continues to signal bearish pressure.
- Bearish scenario carries a 50% probability.
- Recommended trade: SELL between $135.29 - $136.00.
- Risk/reward ratio stands at 1:2.64.
FINAL VERDICT
Trading Decision
| Decision | Value |
|---|---|
| ACTION | SELL |
| Confidence Level | 70% |
| Entry Price | $135.29 |
| Stop Loss | $138.00 |
| Take Profit | $130.00 |
| Risk/Reward | 1:2.64 |
| Success Probability | 50% |
| Timeframe | 1-2 weeks |
WHY THIS TRADE: The technical indicators suggest continued downside pressure, with key support levels being tested in a risk-off environment. This bearish strategy aligns with current market trends.
WHAT MUST HAPPEN: A breach of the $134 support level would confirm the bearish outlook and target lower price levels.
FAQ
SOURCES & REFERENCES
Investing.com: "株式は上昇するも、技術的な壁が依然として焦点" - Read more
The Motley Fool: "VGT vs. XLK: どちらの広範なテクノロジーETFが今、より良い買いか?" - Read more
GET AN EDGE WITH AI ANALYSIS
Tired of missing big moves? InteractiveCrypto Pro uses artificial intelligence to analyze stocks and crypto 24/7.
What you get:
- AI-Powered Signals with 94% historical accuracy
- Real-time Fair Value estimates
- 40+ technical indicators analyzed automatically
- Instant alerts when key levels are hit
LIMITED TIME: 50% OFF - Plans from just $6.49/month
Start Your Free Analysis Now →
Ready to Trade XLK Like a Pro?
InteractiveCrypto Pro gives you the edge with:
- AI-Powered Signals - 94% accuracy
- Real-time Fair Value Estimates
- 40+ Technical Indicators
- Instant alerts on key levels
50% OFF - Just $6.49/month


COMMENTS (0)