
 English
 Spanish
 Deutsch
 Português
 Türkçe
 Italiano
 العربية
 Русский
 Chinese
 Korean
 Japanese
 Vietnamese
 Hebrew
 Hindi
Hindi
 Greek
Greek
 Polish
 Thai
Thai
 Dutch
Dutch
 Malay
Malay
AAPL at Critical Level: Why This Week Matters
Apple Inc. (AAPL) is teetering on the edge of a financial precipice, leaving investors and analysts on high alert. Today, we're diving into the technical maelstrom surrounding AAPL as it navigates a treacherous market landscape where risk-averse sentiments dominate. With AAPL underperforming the market and the specter of a stronger U.S. dollar looming large, this week could set the stage for a dramatic shift in AAPL's trajectory. Here's why this matters now.
Market Dynamics
The market is currently in a Risk-Off regime, a sentiment underscored by the declining positions of SPY and QQQ. This aversion to risk is further exacerbated by an appreciating U.S. dollar, which places additional strain on multinational giants like AAPL, making their products more expensive overseas. Bond yields are rising, as indicated by a drop in TLT, suggesting an uninviting environment for riskier assets. These macroeconomic conditions create a perfect storm that could have profound implications for AAPL and its investors.
AAPL's Underperformance
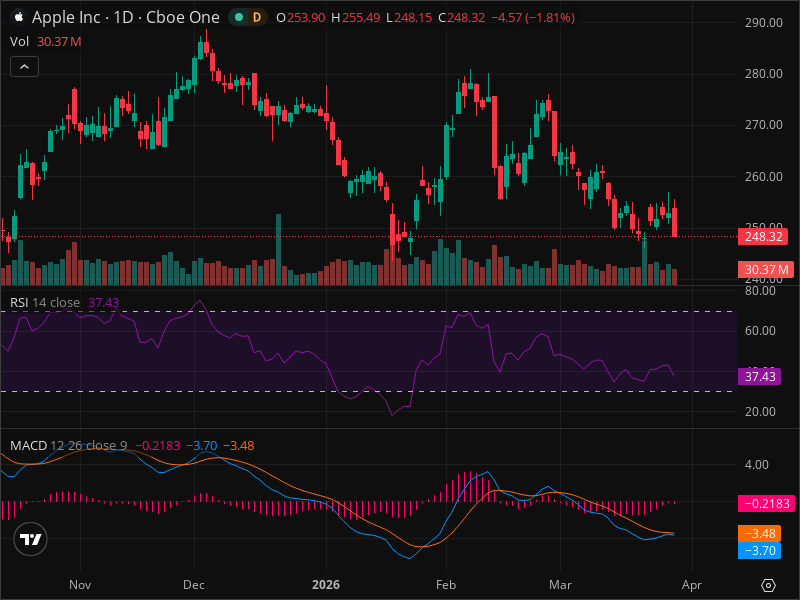
As of today, AAPL is not just sliding alongside the market; it's underperforming. The stock has plummeted by -1.81%, compared to the -1.07% drop in SPY and the -1.51% dip in QQQ. This underperformance raises red flags about AAPL's current footing and its ability to weather the storm. The technical landscape paints a similar picture of caution, with AAPL entrenched in a persistent downtrend. The price has been steadily declining since December 2025, and today's red candlestick only serves to cement this bearish trend. The volume remains average, providing a lackluster confirmation of this downward momentum.
Technical Analysis
Without clear swing points, Fibonacci retracement levels offer limited guidance, leaving traders to speculate about potential reversals. Adding to this uncertainty, no distinct chart formations like Head and Shoulders or Double Tops are visible, further complicating any attempts to predict AAPL's next move. The RSI hovers at 37.43, suggesting room for further decline, while the MACD remains firmly in bearish territory. AAPL continues to languish below key moving averages, reinforcing the bearish sentiment.
Technical indicators spell out a grim narrative for AAPL. Resistance looms overhead at $270-$280, while support levels at $240, $230, and $220 hint at potential barriers that could momentarily halt the fall. Yet, as of now, these levels are being tested with increasing frequency and fragility, raising the stakes for AAPL's short-term outlook.
Scenario Analysis
The market's indecisiveness is mirrored in the three possible scenarios for AAPL. In a bullish scenario, a reversal in market sentiment or a significant positive catalyst specific to AAPL could propel it towards resistance at $255, $265, and even $280. However, this scenario holds only a 25% probability over the next 1-3 months. Conversely, the bearish scenario, with a 50% likelihood, predicts further weakness if AAPL breaks below the critical $240 mark. Here, the price targets drop to $230 and $220 within 1-2 months. A neutral scenario suggests a consolidation between $240-$255 for the coming 2-4 weeks, also carrying a 25% probability.
Trading Strategy
Traders eyeing AAPL should brace for turbulence. Current recommendations advocate a SELL stance with entry points between $248-$252. A prudent stop loss should be set at $257, limiting downside risk to 3.6%. Profit targets at $238 and $230 offer potential rewards of 4.0% and 7.2%, respectively, rendering a risk/reward ratio of 1:1.1. However, even this carefully charted strategy carries inherent risks. Any sudden positive news for AAPL or shifts in the broader market could defy expectations and turn the tide.
The bottom line? AAPL's short-term outlook is precarious. With consistent downward pressure and little to suggest an imminent reversal, the technical setup favors a bearish stance. Yet, as always, market conditions can evolve rapidly, and staying informed is paramount. Smart investors are employing AI-powered analysis tools, such as InteractiveCrypto Pro, to monitor these dynamics in real time.
Key Takeaways:
- Market Regime: Risk-Off
- AAPL Performance: -1.81% decline today
- Resistance Levels: $270-$280
- Support Levels: $240, $230, $220
- RSI: 37.43
- MACD: Bearish
- Scenario Probabilities: Bullish 25%, Bearish 50%, Neutral 25%
- Recommended Action: SELL
- Entry Point: $248-$252
- Stop Loss: $257
- Take Profit: $238, $230
FINAL VERDICT
AAPL Trade Recommendation
- ACTION: SELL
- Confidence Level: 70%
- Entry Price: $250
- Stop Loss: $257
- Take Profit: $230
- Risk/Reward: 1:1.1
- Success Probability: 50%
- Timeframe: 1-2 months
WHY THIS TRADE: The overall technical indicators, including RSI and MACD, align with a bearish outlook. Coupled with the macro environment and AAPL's underperformance, the recommendation to sell reflects the most probable scenario.
WHAT MUST HAPPEN: A persistent break below the $240 support level will confirm this bearish setup; however, a close above $257 would invalidate this thesis, warranting a reassessment.
FAQ:
Sources:
- The Motley Fool: "Micron Just Started Mass-Producing HBM4 for Nvidia's Vera Rubin" - Read more
Ready to Trade AAPL Like a Pro?
InteractiveCrypto Pro gives you the edge with:
- AI-Powered Signals - 94% accuracy
- Real-time Fair Value Estimates
- 40+ Technical Indicators
- Instant alerts on key levels
50% OFF - Just $6.49/month
Start Free Analysis →Compare Your Options:
Compare trading platforms to find the best tools for your strategy.
Compare Platforms →


.png)
.png)
.png)


COMMENTS (0)