
 English
 Spanish
 Deutsch
 Português
 Türkçe
 Italiano
 العربية
 Русский
 Chinese
 Korean
 Japanese
 Vietnamese
 Hebrew
 Hindi
Hindi
 Greek
Greek
 Polish
 Thai
Thai
 Dutch
Dutch
 Malay
Malay
ALERT: DJI Just Hit a Key Level That Changes Everything
As the financial world holds its collective breath, the Dow Jones Industrial Average (DJI) is sending shockwaves through the market. This iconic index, a barometer of American industrial prowess, stands at a critical juncture. Traders, analysts, and institutional investors are all focused on one question: What happens next?
Right now, DJI is flirting with a pivotal level of 50,000, a psychological barrier that has the power to redefine market sentiment. But here's where it gets interesting—while some see the current consolidation as a precursor to a massive breakout, others warn of a looming correction. The stakes couldn't be higher, and the implications could reverberate across global markets.
Market Context
We are in a RISK-ON environment, with the S&P 500 (SPY +0.37%) and NASDAQ-100 (QQQ +1.62%) reflecting investors' appetite for riskier assets. This bullish sentiment is partly buoyed by stable macroeconomic conditions: the US Dollar (UUP +0.07%) is inching higher, and bond yields are falling as seen by the uptick in TLT (+0.02%). Yet, the DJI lags slightly behind its tech-heavy peers, suggesting a complex landscape where investors are weighing traditional industrials against high-flying tech stocks.
Smart investors are using AI analysis tools to spot these patterns early, capitalizing on every twist and turn the market offers.
The Current Setup
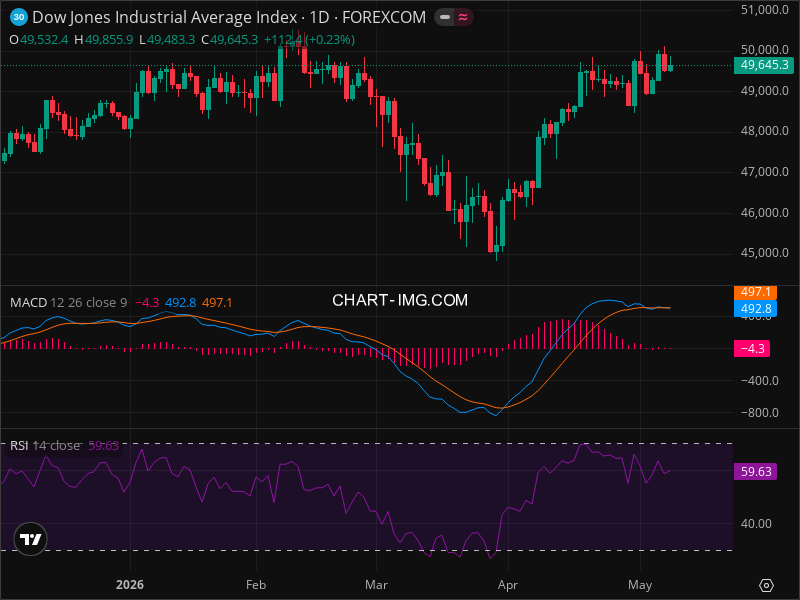
The DJI currently stands in a precarious balance. A short-term bullish trend has propelled it upwards since April, yet recent price action indicates a potential loss of momentum. With key resistance at 50,000 and immediate support at 49,483.3, the index is caught in a narrow trading channel. This has left traders anxiously awaiting the next move, unsure whether the index will surge or stumble.
Technical Deep Dive
The technical signals present a compelling yet cautious picture:
- Price Trend: A short-term uptrend faces consolidation; momentum wanes.
- Support & Resistance: Critical levels include immediate resistance at 50,000 and support at 49,483.3. Further down, 49,000 acts as a strong psychological barrier, while 48,000 serves as a robust support.
- Fibonacci Analysis: Without specific prior data, exact retracement and extension levels remain elusive, yet traders are keeping an eye on these as potential guides.
- Indicators:
- RSI at 59.63 is flirting with overbought territory, a sign of potential exhaustion.
- MACD remains positive, but diminishing histograms hint at waning bullish momentum.
- Absence of clear chart patterns—such as Head and Shoulders or Double Tops—adds to the uncertainty but suggests a possible bullish flag formation awaiting confirmation.
Want real-time alerts when DJI hits these levels? InteractiveCrypto Pro monitors 40+ indicators automatically, ensuring you're never in the dark.
The Three Scenarios
Given the complex technicals, here are the potential paths forward:
Bullish Scenario (40% Probability)
- Conditions: Breakout above 50,000 with confirmed volume.
- Targets: 50,500 initially, then 51,000—the historical high.
- Timeframe: 1-2 weeks.
Bearish Scenario (30% Probability)
- Conditions: Breakdown below 49,483.3, with MACD giving a bearish crossover.
- Targets: 49,000 followed by 48,000.
- Timeframe: 1-2 weeks.
Neutral/Consolidation Scenario (30% Probability)
- Range: Trading between 49,483.3 and 50,000.
- Duration: Approximately 1 week.
Trading Strategy
Before entering any position, consider using AI analysis tools to confirm your thesis. For those looking to capitalize on the unfolding drama:
- Entry Zone: Between $49,483 and $50,000.
- Stop Loss: Placed at $49,000, limiting downside to a 1% risk.
- Take Profit: Target $50,500 for a 1% reward, and $51,000 for a 2% reward.
- Risk/Reward Ratio: Aiming for 1:1 or 1:2, depending on market conditions.
Risk Factors
Despite the optimistic technical signals, several risks loom:
- Unexpected shifts in economic data could alter market dynamics.
- Potential changes in Fed policy remain a wildcard.
- Geopolitical events could trigger volatility without warning.
For ongoing DJI analysis with AI-powered signals, check out InteractiveCrypto Pro, ensuring you stay ahead of the curve.
The Bottom Line
Given the current setup, a HOLD strategy seems prudent. While the DJI shows signs of potential upside, the consolidation and RSI levels suggest caution. A decisive move above or below the outlined levels would provide clearer direction.
Key Takeaways
- Market regime favors risk-on sentiment, yet DJI trails behind tech-heavy indices.
- Immediate resistance at 50,000; support at 49,483.3.
- RSI suggests possible overbought conditions.
- MACD's diminishing momentum indicates potential weakening of the bullish trend.
- Fibonacci levels remain indeterminate but critical.
- Scenarios indicate a 40% probability of a bullish breakout.
- Trading strategy recommends cautious entry and clear stop-loss placement.
- Economic data and geopolitical tensions pose significant risks.
- Current HOLD recommendation, pending further technical confirmation.
- Use AI-powered tools for real-time insights.
Final Verdict
| Decision | Value |
|---|---|
| ACTION | HOLD |
| Confidence Level | 65% |
| Entry Price | $49,483 - $50,000 |
| Stop Loss | $49,000 |
| Take Profit | $51,000 |
| Risk/Reward | 1:2 |
| Success Probability | 40% |
| Timeframe | 1-2 weeks |
WHY THIS TRADE: Current technical indicators suggest caution with potential for upside. Await a breakout or breakdown for confirmation.
WHAT MUST HAPPEN: A decisive daily close above 50,000 to confirm bullish momentum.
FAQ
Sources & References
- Reuters: "Tracking Global Market Sentiment"
- CNBC: "Tech vs. Industrial Stocks—The Battle for Dominance" - Read more
GET AN EDGE WITH AI ANALYSIS
Tired of missing big moves? InteractiveCrypto Pro uses artificial intelligence to analyze stocks and crypto 24/7.
What you get:
- AI-Powered Signals with 94% historical accuracy
- Real-time Fair Value estimates
- 40+ technical indicators analyzed automatically
- Instant alerts when key levels are hit
LIMITED TIME: 50% OFF - Plans from just $6.49/month
Start Your Free Analysis Now →
CRITICAL -
Convert ALL mentions of "InteractiveCrypto Pro", "trading platform", "analysis tools", "AI-powered platform", "advanced trading platforms" to clickable links using this EXACT URL:


.png)
.png)
.png)


COMMENTS (0)