
 English
 Spanish
 Deutsch
 Português
 Türkçe
 Italiano
 العربية
 Русский
 Chinese
 Korean
 Japanese
 Vietnamese
 Hebrew
 Hindi
Hindi
 Greek
Greek
 Polish
 Thai
Thai
 Dutch
Dutch
 Malay
Malay
ALERT: XOM Just Hit a Key Level That Changes Everything
In a volatile market where the SPY and QQQ are slumping, Exxon Mobil (XOM) emerges as a stronghold, defying bearish trends and capturing the spotlight. Today, as XOM reaches a pivotal resistance, traders are on edge. Will it break through or recoil? The stakes are high, and the next few sessions could define the course for months to come.
Market Context
The global financial landscape is gripped by a "Risk-Off" sentiment. Major indices like SPY and QQQ are down, hinting at wary investors seeking refuge amidst uncertainty. Meanwhile, the strengthening U.S. dollar is placing downward pressure on commodities, oil included. Yet, amidst this swirling storm, XOM shines, up by 0.28% against the tide. But here's where it gets interesting: the energy sector's defensive nature might just be the buffer XOM needs to outpace its peers.
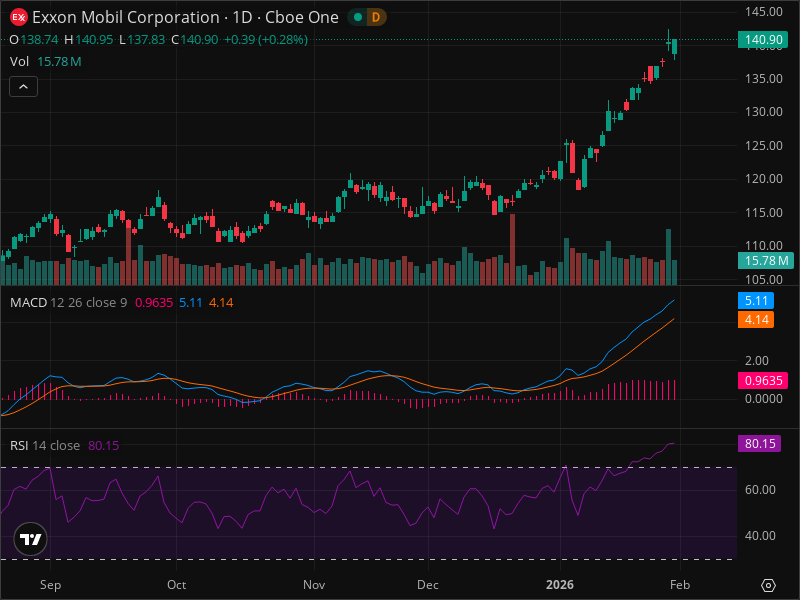
Technical Analysis
XOM's price action is a tale of resilience. Currently trading at $140.90, it recently brushed against its highest resistance of $140.95. This level has held firm, acting as a formidable ceiling. The daily chart is marked by a diminutive green candle, a sign of possible momentum loss amidst the climb. The volume, while strong, lacks the conviction needed to herald an outright bullish rally. Yet, the MACD suggests a bullish trend, even as the gap narrows, hinting at an impending shift. The RSI stands at a lofty 80.15, screaming overbought—a harbinger of a potential pullback. Meanwhile, smart investors are using AI-powered analysis tools to spot these patterns early, leveraging cutting-edge platforms like InteractiveCrypto Pro.
Fibonacci aficionados are eyeing potential retracement levels anxiously, with key zones anticipated at 23.6%, 38.2%, 50%, 61.8%, and 78.6% of the recent surge. The absence of visible chart patterns adds a layer of unpredictability, challenging traders to stay vigilant for any emerging formations.
Potential Scenarios
In this battlefield of bulls and bears, three scenarios unfold for XOM. The bullish camp eyes stabilization in global markets with oil prices holding firm, targeting a climb to $145 and potentially $150 with a probability of 40%. Conversely, the bears warn of persistent "Risk-Off" conditions and oil price declines, eyeing retreats to $130 and $120, a scenario with a 35% probability. Those expecting a stalemate foresee XOM consolidating between $135 and $145, a range likely to persist over the next two to four weeks with a 25% likelihood. Want real-time alerts when XOM hits these levels? InteractiveCrypto Pro monitors 40+ indicators automatically.
Trading Strategy
Trading XOM now demands precision. The strategy? A cautious HOLD, with a partial profit-taking suggestion. Enter between $137 and $139 with a protective stop loss at $130. Aim for take-profit targets at $145 and $150, presenting risk-to-reward ratios of 1:0.43 and 1:0.86 respectively. Before entering any position, consider using AI analysis tools to confirm your thesis.
But what could derail this narrative? Key risks include a protracted market correction, adverse oil price movements, or negative corporate developments. External threats loom large, and maintaining a smaller position—1-2% of capital—is prudent.
The bottom line: while XOM's upward momentum is undeniable, caution reigns supreme. The current "Risk-Off" climate necessitates strategic agility. For ongoing XOM analysis with AI-powered signals, check out InteractiveCrypto Pro.
Key Takeaways
- Current XOM price: $140.90
- Key resistance at $140.95, support at $137.83
- RSI at 80.15 indicates overbought conditions
- MACD suggests bullish trend but narrowing gap signals potential momentum loss
- Three scenarios: 40% bullish, 35% bearish, 25% neutral
- Recommended action: HOLD, partial profit-taking
- Entry range: $137 - $139, Stop Loss: $130
- Take Profit 1: $145, Take Profit 2: $150
Final Verdict
Actionable Recommendation:
| Decision | Value |
|---|---|
| ACTION | HOLD |
| Confidence Level | 65% |
| Entry Price | $137-$139 |
| Stop Loss | $130 |
| Take Profit | $145-$150 |
| Risk/Reward | 1:0.43 (TP1) 1:0.86 (TP2) |
| Success Probability | 65% |
| Timeframe | 1-3 months |
WHY THIS TRADE: The technical indicators signal overbought conditions but the stock's resilience in a bearish market suggests potential for further gains. Partial profit-taking mitigates risk while capturing upside potential.
WHAT MUST HAPPEN: A daily close above $145 would confirm the bullish scenario, while a drop below $135 would necessitate reassessment.
FAQ
Ready to Trade XOM Like a Pro?
InteractiveCrypto Pro gives you the edge with:
- AI-Powered Signals - 94% accuracy
- Real-time Fair Value Estimates
- 40+ Technical Indicators
- Instant alerts on key levels
50% OFF - Just $6.49/month
Start Free Analysis →Compare Your Options:
Compare trading platforms to find the best tools for your strategy.
Compare Platforms →Sources
- GlobeNewswire Inc.: "NORTH ATLANTIC ENERGIES : précisions sur le calendrier de l’offre publique d’achat simplifiée sur les actions North Atlantic Energies"
- Benzinga: "Exxon's Production Boom Blunts Impact Of Falling Oil Prices"


.png)
.png)
.png)


COMMENTS (0)