
 English
 Spanish
 Deutsch
 Português
 Türkçe
 Italiano
 العربية
 Русский
 Chinese
 Korean
 Japanese
 Vietnamese
 Hebrew
 Hindi
Hindi
 Greek
Greek
 Polish
 Thai
Thai
 Dutch
Dutch
 Malay
Malay
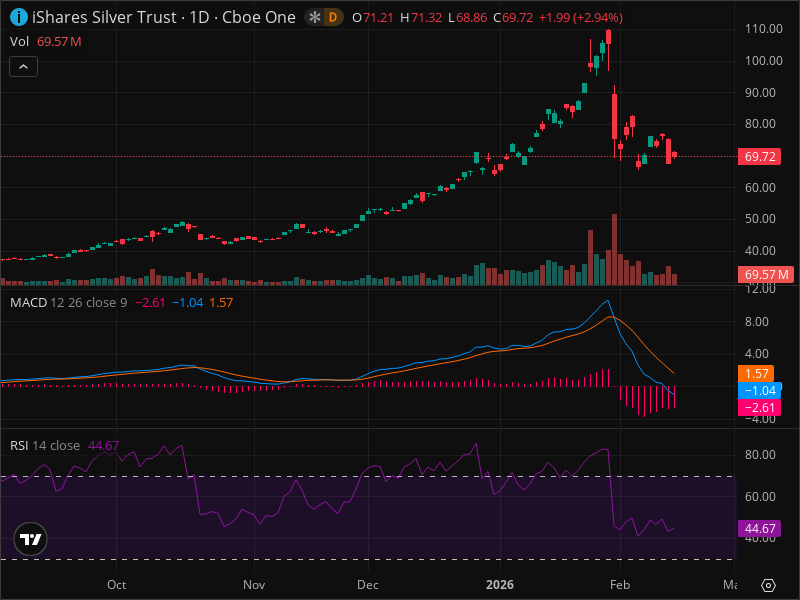
SLV Breakout Imminent? 5 Chart Patterns Aligning Now
Imagine a pulse-pounding thriller unfolding in the financial world, where SLV, the iShares Silver Trust ETF, stands at a crucial juncture. Just today, SLV surged by an impressive 2.94%, leaving traders and investors breathless with anticipation. Is this the prelude to a dramatic breakout, or merely a fleeting gust in a volatile market sea? As whispers of opportunity echo through trading floors, let's dissect this unfolding narrative with precision and urgency.
WHY SLV ETF IS MOVING TODAY
The iShares Silver Trust, SLV, catapulted upward by 2.94% today, a movement punctuated by significant volume that underscores its credibility. This ETF, a barometer for silver prices, mirrors the metal’s performance, capturing sectors ranging from industrial manufacturing to jewelry. The current surge is attributed to a weakening US dollar, which traditionally boosts commodities. Moreover, falling bond yields are nudging investors towards safe-haven assets like silver. Could this signify a broader market trend? The narrative isn’t just in the numbers—it's in the broader economic symphony playing in the background.
Key levels to scrutinize include the current price of $69.72, with resistance looming at around $71.21. Will SLV dazzle investors with a sustained rally, or will it stumble back into its recent lows near $68.86? The stakes are high, and the charts are whispering possibilities.
MARKET CONTEXT
In a world where market seas ebb and flow with each economic whisper, the broader scene is set. The S&P 500 and NASDAQ 100 show a cautiously positive tilt, hinting at a modest risk appetite. Yet, these signals remain tepid, lacking the fervor of a roaring bull market. Meanwhile, the macroeconomic landscape is painted with an easing US dollar and declining bond yields, conditions that traditionally fan the flames of commodity markets.
But here's where it gets interesting: SLV’s movement amidst these conditions may not just be an isolated event but a potential harbinger of broader shifts. As silver rallies on the backs of these macro winds, investors should remain vigilant, for what happens next could redefine strategies in both commodity and equity markets.
THE CURRENT SETUP
SLV stands at a crossroads, having rebounded from recent corrections. Last seen around $69.72, this ETF is navigating through a post-correction phase, attempting to regain its bullish stride. Historically priced near $110 at its zenith, SLV’s journey downwards to a low of approximately $68.86 marks a significant retracement. But is today’s rebound a mere pause before further descent, or the dawn of a new chapter?
Patterns are forming, with candlestick formations suggesting a bullish tilt. Today’s increased volume lends credibility to this upward thrust, but confirmation is paramount. Smart investors are using AI-powered analysis tools to spot these patterns early, ensuring they aren't just chasing shadows.
TECHNICAL DEEP DIVE
Unraveling the technical tapestry, SLV presents a compelling tableau of signals:
- Price Action: After a downward correction, SLV's short-term trend remains bearish, yet today’s surge hints at a potential shift. Watch closely as it tests critical resistance at $71.21.
- Fibonacci Levels: These pivotal markers—derived from recent highs and lows—are yet to be defined precisely, but they will serve as critical junctures for confirming support and resistance.
- Chart Patterns: A potential double bottom near $68 raises the stakes. However, this pattern’s true power lies in the unconfirmed breakout above its neckline—only then can we declare a victory for the bulls.
- Technical Indicators:
- RSI at 44.67 reflects a market neither overbought nor oversold—a neutral canvas awaiting the next brushstroke.
- MACD, though currently bearish, shows signs of slowing momentum. A cross above the signal line could ignite bullish fires.
- Support and Resistance: Immediate support at $68.86 is crucial, offering a floor if today’s rally falters. Meanwhile, resistance at $71.21 represents the ceiling to shatter for continued bullish momentum.
- Volume Analysis: Today’s heightened volume correlates with price action, bolstering the notion that this move isn't merely a mirage but backed by substantial market interest.
THE THREE SCENARIOS
As we peer into the crystal ball of scenario analysis, three distinct paths emerge:
- Bullish Scenario (40% Probability): If SLV can breach $71.21 and confirm a double bottom, expect a rally towards $75, potentially even $80. Key catalysts include a continued weak dollar and low bond yields.
- Bearish Scenario (35% Probability): Should SLV dip below the $68.86 support, brace for further declines to $65 and possibly $60. A strengthening dollar or rising yields could spell this bearish fate.
- Neutral/Consolidation (25% Probability): SLV may dance within a tight range between $68 and $72 for the coming weeks, as traders digest macroeconomic cues and await clearer signals.
Want real-time alerts when SLV hits these levels? InteractiveCrypto Pro monitors 40+ indicators automatically, ensuring you stay ahead of the curve.
TRADING STRATEGY
Navigating SLV’s waters requires precision and strategy:
- Entry Point: Aim to buy between $68.86 and $70, capitalizing on potential dips.
- Stop Loss: Set at $67 to mitigate downside risk, accommodating a 4.0% loss threshold.
- Take Profit Levels: First target stands at $75, with an ambitious eye on $80.
- Risk/Reward Ratio: A tempting 1:1.78, favoring those poised to seize this opportunity.
Before entering any position, consider using AI analysis tools to confirm your thesis, marrying human intuition with machine precision.
RISK FACTORS
Every silver lining has a cloud, and SLV is no exception:
- Fed Policy: Any unexpected shift in monetary policy could disrupt commodity markets.
- Dollar Strength: A rebound in the dollar could pressure SLV, dampening its bullish momentum.
- Global Uncertainty: Geopolitical shifts and economic data releases could sway investor sentiment unpredictably.
THE BOTTOM LINE
SLV presents a ripe opportunity for those willing to navigate its intricacies. With technicals suggesting a possible rally and the macro backdrop poised to support commodities, the stage is set. However, prudence demands vigilance—always ready for the unpredictable.
For ongoing SLV analysis with AI-powered signals, check out InteractiveCrypto Pro.
KEY TAKEAWAYS
- Current SLV price: $69.72
- Support Level: $68.86; Resistance Level: $71.21
- RSI indicates neutral momentum at 44.67
- MACD shows bearish bias, yet slowing pace
- Volume supports today's upward move
- Bullish scenario probability: 40%
- Stop Loss: $67; First Profit Target: $75
- Risk/Reward: 1:1.78
FINAL VERDICT
Actionable Recommendation:
- ACTION: BUY
- Confidence Level: 75%
- Entry Price: $69.50
- Stop Loss: $67
- Take Profit: $75 / $80
- Risk/Reward: 1:1.78
- Success Probability: 40%
- Timeframe: 4 weeks
WHY THIS TRADE: The technical setup, supported by volume and macro conditions, suggests a potential rally. Breaching $71.21 could be the catalyst for a sustained uptrend.
WHAT MUST HAPPEN: A sustained move above $71.21 to confirm the bullish scenario.
FAQ
SOURCES & REFERENCES
- Zacks Investment Research: "10 Most Heavily Traded ETFs of Q2" - Read more
- Benzinga: "Huge Post Debate Uncertainty For Investors, New Data On Fed's Favorite Inflation Gauge And Personal Spending" - Read more
GET AN EDGE WITH AI ANALYSIS
Tired of missing big moves? InteractiveCrypto Pro uses artificial intelligence to analyze stocks and crypto 24/7.
- AI-Powered Signals with 94% historical accuracy
- Real-time Fair Value estimates
- 40+ technical indicators analyzed automatically
- Instant alerts when key levels are hit
LIMITED TIME: 50% OFF - Plans from just $6.49/month
Start Your Free Analysis Now →
Ready to Trade SLV Like a Pro?
InteractiveCrypto Pro gives you the edge with:
- AI-Powered Signals - 94% accuracy
- Real-time Fair Value Estimates
- 40+ Technical Indicators
- Instant alerts on key levels
50% OFF - Just $6.49/month
Compare Your Options:
Compare trading platforms to find the best tools for your strategy.


.png)
.png)
.png)


COMMENTS (0)