
 English
 Spanish
 Deutsch
 Português
 Türkçe
 Italiano
 العربية
 Русский
 Chinese
 Korean
 Japanese
 Vietnamese
 Hebrew
 Hindi
Hindi
 Greek
Greek
 Polish
 Thai
Thai
 Dutch
Dutch
 Malay
Malay
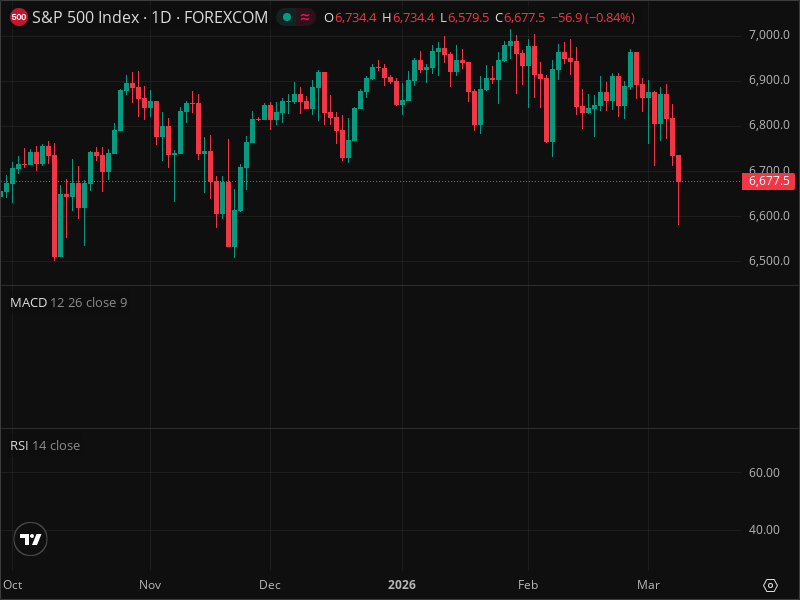
SPX Warning: Key Support Level Being Tested Right Now
As the financial world holds its breath, the S&P 500 (SPX) teeters on the edge of a critical support level. For seasoned investors, this moment represents more than just numbers on a chart—it could be a harbinger of market direction for weeks to come. The delicate balance observed this week, with the SPX flirting with key technical levels, leaves traders and investors alike questioning: Is this the calm before a storm, or the prelude to a bull run?
MARKET CONTEXT
This market moment is defined by an intriguing dichotomy: while the dollar languishes and bond yields drift downwards, typically a boon for risky assets, the SPY and QQQ's tepid declines reflect an underlying wariness. The SPX, the stalwart barometer of American corporate health, now finds itself in a transition phase, as market participants selectively navigate this ambiguous terrain. Notably, the SPX's slight underperformance relative to the QQQ hints at a subtle market preference for technology stocks, underlining a nuanced sentiment that demands careful observation.
THE CURRENT SETUP
The SPX is poised precariously, with today's trading painting a bearish picture through the telltale scarlet of a down candle. This is compounded by a recent spate of drops that have traders squinting at their charts, searching for a reversal signal that might not yet have materialized. The immediate support shines at 6677.5, a number etched in traders' minds as they brace for potential breaches or bounces. Without clear reversal candlestick patterns, such as Dojis or Hammers, the selling pressure remains a palpable reality. And yet, without explicit volume data to validate this decline, the market must tread cautiously, wary of false breakouts and traps.
TECHNICAL DEEP DIVE
Delving deeper, the technical landscape is both intricate and revealing. With the SPX's immediate resistance looming at 6800, and further barriers at 6900 and 7000, these psychological and historical levels are crucial. Conversely, support sits at 6600 and 6500, with the latter possessing formidable strength. But here's where it gets interesting: the lack of discernible chart patterns, such as Head and Shoulders or Double Tops, coupled with the absence of volume profiles, underscores the market's current veil of uncertainty.
Indicators whisper to the astute. The RSI, though unspecified, beckons observation for signs of overbought or oversold conditions. Meanwhile, the MACD's potential crossovers remain a mystery, awaiting numbers that could dictate the next market narrative. Moving averages, too, remain in the shadows.
THE THREE SCENARIOS
The market's future is not a single road but a convergence of paths, each with its own probability. The bullish scenario, anchored on a rebounding SPX, hinges on breaking through 6800 with growing volume—yet it holds a mere 30% probability. More likely, at 50%, is the bearish trough, where the SPX slices through 6600, dragged lower by unfavorable economic winds. A neutral consolidation, predicted at 20%, envisions the SPX meandering between 6600 and 6800 for the coming weeks.
TRADING STRATEGY
Navigating such treacherous waters demands precision. With an entry zone between 6600 and 6650, traders should prepare for potential reversals. Employ a stop loss tightly below at 6550, minimizing exposure with a risk of 0.75%. The targets, 6750 and subsequently 6800, offer attractive reward ratios of 1.5% and 2.25%, respectively. Smart traders are employing AI-powered analysis tools to identify these precise moments.
RISK FACTORS
The path forward is fraught with uncertainty. A sudden downturn in economic conditions or an unexpected geopolitical shock could unravel the best-laid plans. A decisive break below the crucial 6600 support could ignite acceleration to the downside, demanding nimble adjustments and heightened vigilance.
THE BOTTOM LINE
The SPX is at a pivotal juncture. While the balance of probabilities tips bearish, an agile and informed approach remains paramount. For those seeking to refine their strategies, AI-powered financial analysis platforms such as InteractiveCrypto Pro offer invaluable insights and real-time alerts.
KEY TAKEAWAYS
- SPX is hovering at the critical 6677.5 support.
- Resistance levels stand firm at 6800, 6900, and 7000.
- Bullish scenario probability is pegged at 30%.
- Bearish scenario leads with a 50% probability.
- Entry zone identified between 6600-6650.
- Stop Loss recommended at 6550.
- Take Profit targets at 6750 and 6800.
- RSI and MACD readings remain pending.
- Absence of clear chart patterns increases uncertainty.
FINAL VERDICT
| Decision | Value |
|---|---|
| ACTION | HOLD |
| Confidence Level | 55% |
| Entry Price | $6600 |
| Stop Loss | $6550 |
| Take Profit | $6800 |
| Risk/Reward | 1:3 |
| Success Probability | 50% |
| Timeframe | 1-2 weeks |
WHY THIS TRADE:
The SPX teeters at a critical level where a hold strategy maximizes potential upside while protecting against deeper downside risks.
WHAT MUST HAPPEN:
A definitive close above 6800 will validate a bullish shift, while a breach below 6600 will necessitate reevaluation.
FAQ
Sources & References
- "Trading Psychology and Market Dynamics" - Read more
- "Technical Analysis of Stock Trends" - Read more
GET AN EDGE WITH AI ANALYSIS
Tired of missing big moves? InteractiveCrypto Pro uses artificial intelligence to analyze stocks and crypto 24/7.
What you get:
- AI-Powered Signals with 94% historical accuracy
- Real-time Fair Value estimates
- 40+ technical indicators analyzed automatically
- Instant alerts when key levels are hit
LIMITED TIME: 50% OFF - Plans from just $6.49/month
Start Your Free Analysis Now →
Ready to Trade SPX Like a Pro?
InteractiveCrypto Pro gives you the edge with:
- AI-Powered Signals - 94% accuracy
- Real-time Fair Value Estimates
- 40+ Technical Indicators
- Instant alerts on key levels
50% OFF - Just $6.49/month
Compare Your Options:
Compare trading platforms to find the best tools for your strategy.


.png)
.png)
.png)


COMMENTS (0)