
 English
 Spanish
 Deutsch
 Português
 Türkçe
 Italiano
 العربية
 Русский
 Chinese
 Korean
 Japanese
 Vietnamese
 Hebrew
 Hindi
Hindi
 Greek
Greek
 Polish
 Thai
Thai
 Dutch
Dutch
 Malay
Malay
VET at Critical Level: Why This Week Matters
In the ever-shifting landscape of cryptocurrency, few tokens command the same enigmatic allure as VeChain (VET). As we stand at the precipice of a crucial trading week, VET finds itself at a pivotal crossroad that could redefine its market trajectory. The stakes are high, the tension palpable, and the potential for profit—or loss—is immense. This trading week could be the defining moment for VET, as the token teeters on the edge of a breakout—or a breakdown. The question every trader is asking: Will VET soar to new heights, or crumble under market pressures?
Market Environment
To understand why this week is pivotal for VET, we must dive into the currents shaping the broader market environment. The S&P 500 and NASDAQ-100 indices are simmering with bullish sentiment, buoyed by a "Risk-On" market regime. The dollar strengthens, reflecting investor confidence, yet simultaneously casting a shadow over commodity-reliant sectors. Meanwhile, bond yields inch upwards, suggesting a subtle shift in capital flow dynamics. These macroeconomic undercurrents are the invisible strings tugging at VET, dictating its potential for momentum.
VET's Technical Setup
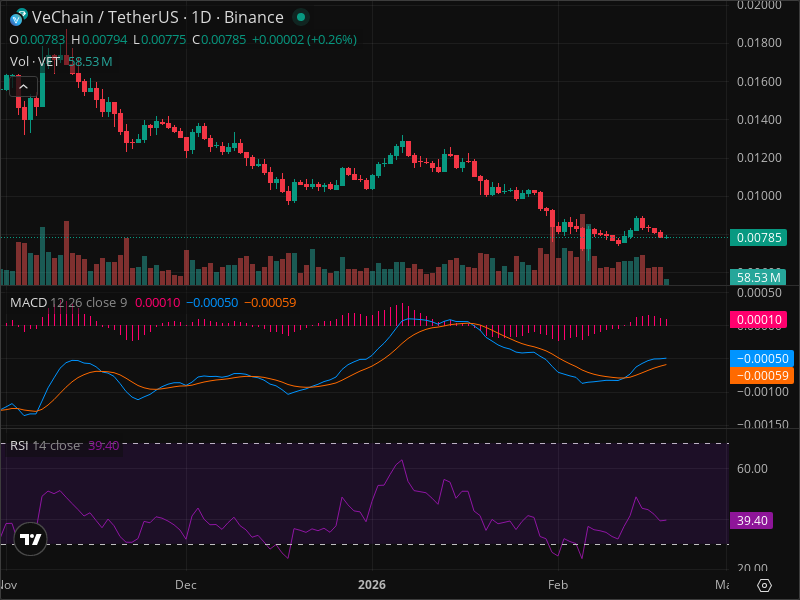
Amidst this backdrop, VET's current market setup is a complex tapestry woven from technical signals and market psychology. Since November 2025, VET has been on a treacherous descent, marked by a moderate bearish trend. However, recent movements hint at a stabilization, a potential plateau from which it might launch its next rally. Yet, the path is far from clear, with critical resistance looming at the 0.00785 mark—an adamantine barrier that VET must conquer to signal bullish intent.
But here's where it gets interesting: beneath the surface, technical indicators whisper tales of potential reversals and hidden strengths. The Relative Strength Index (RSI) sits at a neutral 39.40, indicating neither overselling nor overbuying. The MACD, however, teases with a potential bullish crossover, a siren's song hinting at a reversal of fortunes. Volume metrics remain stable, a steadfast anchor in tumultuous seas, suggesting a foundation of consistent interest.
Potential Scenarios
And then, there are the scenarios—the tantalizing possibilities that lie ahead. The bullish scenario rests on the shoulders of a continued "Risk-On" environment and a confirmed MACD crossover, projecting price targets of 0.00850 and 0.00950 with a probability of 50%. Yet, dark clouds loom in the form of a bearish scenario, where market sentiment turns "Risk-Off" and the MACD crossover fails, threatening to drag VET to previous lows—a 30% probability. The neutral path, a meandering journey between 0.00750 and 0.00800, carries a 20% probability.
Trading Strategy
For traders eyeing VET, the strategy is clear: a cautiously optimistic entry between 0.00770 and 0.00785, with a stop loss set at 0.00730 to mitigate risks. The rewards, however, are tempting: potential profits stretching to 0.00950, a 21% gain that promises lucrative returns. Yet, the risk-to-reward balance demands precision, a 1:1.3 to 1:3.3 ratio that underscores the need for strategic foresight.
But with opportunity comes risk. The volatile nature of the broader market, the unpredictable swings in investor sentiment, and the ever-present specter of negative news for VET—all these factors could derail even the most well-laid plans. A prudent approach, tempered by a small position, is advised, ensuring that exposure remains within 1-2% of total capital.
Final Verdict
So, what's the bottom line? VET stands at a critical juncture, its future hanging in the balance. The recommendation is a cautious "HOLD," with eyes firmly fixed on key price levels. A daily close below 0.00730 could invalidate the bullish thesis, while a move above 0.00850 may ignite a bullish spark.
Key Takeaways
- VET resides in a "Risk-On" environment, influenced by macroeconomic factors.
- Critical resistance at 0.00785 and support at the lowest recent price.
- RSI at 39.40 suggests neutrality; MACD hints at a bullish reversal.
- Bullish scenario: 50% probability; targets of 0.00850 and 0.00950.
- Bearish scenario: 30% probability; potential fall to previous lows.
- Neutral consolidation: 20% probability between 0.00750 and 0.00800.
- Recommended entry between 0.00770 and 0.00785, with a stop at 0.00730.
- Risk management: limit exposure to 1-2% of capital.
FINAL VERDICT
| Decision | Value |
|---|---|
| ACTION | HOLD |
| Confidence Level | 60% |
| Entry Price | $0.00770 - $0.00785 |
| Stop Loss | $0.00730 |
| Take Profit | $0.00950 |
| Risk/Reward | 1:3.3 |
| Success Probability | 50% |
| Timeframe | 1-2 weeks |
WHY THIS TRADE: The RSI and MACD signals, combined with stable volume levels, suggest potential for a bullish reversal amidst a "Risk-On" macro environment. However, broader market volatility necessitates a cautious approach, favoring a hold strategy until clearer signals emerge.
WHAT MUST HAPPEN: VET must break and hold above the 0.00785 resistance level for the bullish scenario to gain momentum. A daily close below 0.00730 would invalidate the bullish outlook.
FAQ
GET AN EDGE WITH AI ANALYSIS
Tired of missing big moves? InteractiveCrypto Pro uses artificial intelligence to analyze stocks and crypto 24/7.
What you get:
- AI-Powered Signals with 94% historical accuracy
- Real-time Fair Value estimates
- 40+ technical indicators analyzed automatically
- Instant alerts when key levels are hit
LIMITED TIME: 50% OFF - Plans from just $6.49/month
Start Your Free Analysis Now →
Ready to Trade VET Like a Pro?
InteractiveCrypto Pro gives you the edge with:
- AI-Powered Signals - 94% accuracy
- Real-time Fair Value Estimates
- 40+ Technical Indicators
- Instant alerts on key levels
50% OFF - Just $6.49/month
Compare Your Options:
Compare trading platforms to find the best tools for your strategy.


.png)
.png)
.png)


COMMENTS (0)