
 English
 Spanish
 Deutsch
 Português
 Türkçe
 Italiano
 العربية
 Русский
 Chinese
 Korean
 Japanese
 Vietnamese
 Hebrew
 Hindi
Hindi
 Greek
Greek
 Polish
 Thai
Thai
 Dutch
Dutch
 Malay
Malay
WIF Breakout Imminent? 5 Chart Patterns Aligning Now
As the digital financial landscape evolves, certain cryptocurrencies suddenly capture the spotlight, leaving traders and investors asking one crucial question: is this the right moment to jump on the bandwagon, or a trap waiting to spring? Today, all eyes are on WIF, a cryptocurrency that’s generating significant buzz across social media and within crypto communities. But is this excitement justified, or is it the foreboding calm before the storm?
The current allure of WIF lies not only in its social media virality but also in the potential market movements it promises. While the cryptocurrency world can turn volatile in the blink of an eye, understanding both the technical and fundamental aspects of WIF is essential for any serious investor. Today, we dive deep into the intricate dance of market indicators and chart patterns that suggest a breakout might be on the horizon.
WHY WIF IS TRENDING NOW
- The Buzz: WIF has become the darling of crypto discussions, striking a chord in digital forums and attracting a whirlwind of attention from both retail investors and speculators. This sudden interest is propelled by an intriguing mix of chart patterns and potential market shifts.
- Social Media Magnet: The spike in social media engagement is largely driven by influencers and analysts speculating a breakout based on current technical setups. Memes, tweets, and viral videos featuring bold predictions about WIF's future have flooded platforms like Twitter and Reddit.
- Fundamental Backing?: Despite the buzz, the fundamentals of WIF remain modest. Analysts question whether the current hype is reflected in its intrinsic value or if it's merely a speculative bubble.
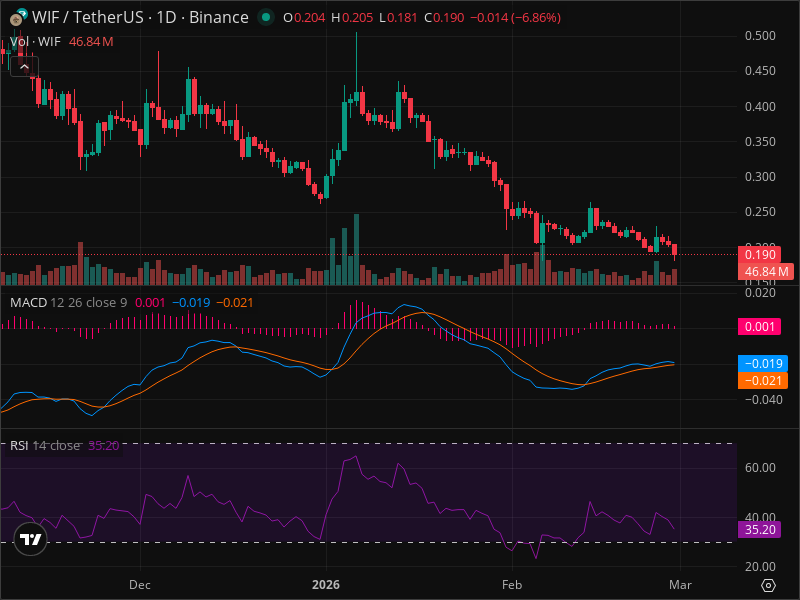
- Key Levels Amid Volatility: With increased chatter, all eyes are on critical price levels. Key support is noted at $0.18, while resistance looms at $0.25. A breach of these could dictate the short-term trajectory amid heightened volatility.
MARKET CONTEXT
Globally, markets are in a RISK-ON regime. This positive sentiment is mirrored in traditional equity indices with the SPY and QQQ showing gains, indicating a broader appetite for risk. A weaker dollar and declining bond yields further bolster the case for riskier assets like cryptocurrencies. However, it's important to note that WIF is underperforming today, down by 6.86%, suggesting that its market dynamics are influenced by factors beyond the general risk-on sentiment.
THE CURRENT SETUP
Despite the optimistic macro backdrop, WIF is charting a bearish path. Trading at approximately $0.190, recent price action has leaned towards the downside, with no clear reversal patterns visible in the short term. Volume remains moderate, indicating that while the sell-off isn’t panicked, it’s steady enough to warrant caution. Meanwhile, technical indicators like RSI hint at oversold conditions—a classic setup for potential reversal but not yet corroborated by price action or volume.
TECHNICAL DEEP DIVE
The technical landscape of WIF reveals a tapestry of indicators and chart patterns:
- Price Action: A downward trend persists, unequivocally confirmed by a bearish current candle. The absence of a reversal pattern suggests continuation unless a significant catalyst emerges.
- Fibonacci Retracement Levels: Without clear reference points, Fibonacci suggests potential resistances at $0.25 and $0.35 should a rebound occur.
- Support and Resistance: Resistance at $0.25 and $0.30 acts as psychological barriers, while supports at $0.18 and $0.15 offer potential cushions.
- Indicators: RSI at 35.20 signals overselling. However, without divergence, the bearish MACD remains a concern. The MACD histogram shows a minor positive but insufficient for bullish optimism. The price lingering below key moving averages further strengthens the bearish sentiment.
THE THREE SCENARIOS
- Bullish: A surprising bullish crossover in MACD paired with a break above $0.25 could flip sentiment. Targets then align at $0.30 and $0.40, with a 30% probability over 1-2 months.
- Bearish: If sentiment continues sour and prices dip below $0.18, the next fall could target $0.15, even $0.10, with a 50% probability in 2-4 weeks.
- Neutral: Price consolidation between $0.18 and $0.25 is plausible as the market digests broader crypto movements, with a 20% probability spanning 2-3 weeks.
TRADING STRATEGY
For those considering a position in WIF, prudence is key. The recommended action is to sell within the $0.190 - $0.200 range. Employ a stop loss at $0.23 to mitigate 15% risk, with take profit targets at $0.15 and $0.10. This strategy offers a risk/reward ratio of 1:1.67. Before engaging, savvy investors should leverage AI analysis tools to validate their decisions, such as the InteractiveCrypto Pro for real-time insights.
RISK FACTORS
The unpredictability of the crypto market means that even a robust strategy can be thwarted by sudden market sentiment shifts or unforeseen news impacting WIF. Monitoring liquidity levels is crucial, as low liquidity can exacerbate price volatility.
THE BOTTOM LINE
Amidst prevailing bearish signals, a cautious selling approach with strategic protection is advisable. However, traders must remain vigilant, ready to pivot should the technical landscape shift swiftly. For those seeking real-time analysis and alerts, InteractiveCrypto Pro offers pivotal support.
KEY TAKEAWAYS
- WIF is currently trading at $0.190 amidst a broader risk-on market.
- Resistance levels of interest are $0.25 and $0.30.
- Support levels to monitor include $0.18 and $0.15.
- The RSI at 35.20 indicates overselling without divergence.
- MACD remains bearish with a positive histogram but no crossover.
- Fibonacci indicates possible resistance at $0.25 upon rebound.
- Probability: Bullish 30%, Bearish 50%, Neutral 20%.
- Recommended action: Sell with defined stop losses and profit targets.
- Employ AI tools like InteractiveCrypto Pro.
FINAL VERDICT
| Decision | Value |
|---|---|
| ACTION | SELL |
| Confidence Level | 70% |
| Entry Price | $0.190 |
| Stop Loss | $0.23 |
| Take Profit | $0.10 |
| Risk/Reward | 1:1.67 |
| Success Probability | 50% |
| Timeframe | 2-4 weeks |
WHY THIS TRADE: The bearish setup is underscored by the MACD's downward momentum and lack of reversal patterns, suggesting an opportunity for short positions with protective stops.
WHAT MUST HAPPEN: A sustained move above $0.25 would negate the bearish outlook, necessitating a reassessment of strategy.
FAQ
Sources & References
- Bloomberg: "Cryptocurrency Market Overview" - Read more
- CoinDesk: "Understanding Market Trends in Crypto" - Read more
Ready to Trade WIF Like a Pro?
InteractiveCrypto Pro gives you the edge with:
- AI-Powered Signals - 94% accuracy
- Real-time Fair Value Estimates
- 40+ Technical Indicators
- Instant alerts on key levels
50% OFF - Just $6.49/month
Start Free Analysis →Compare Your Options:
Compare trading platforms to find the best tools for your strategy.
Compare Platforms →


.png)
.png)
.png)


COMMENTS (0)