
 English
 Spanish
 Deutsch
 Português
 Türkçe
 Italiano
 العربية
 Русский
 Chinese
 Korean
 Japanese
 Vietnamese
 Hebrew
 Hindi
Hindi
 Greek
Greek
 Polish
 Thai
Thai
 Dutch
Dutch
 Malay
Malay
XLF Momentum Shift: The Signals Smart Money Is Watching
In the volatile world of finance, a single day can alter the trajectory of even the most steadfast sectors. The XLF, State Street Financial Select Sector SPDR Fund, just plummeted 3.19% today, raising eyebrows across Wall Street. But here's where it gets interesting: beneath the surface, a mosaic of pressures and opportunities is revealing itself, potentially setting the stage for a strategic play. This isn't just another dip; it's a clarion call for astute investors.
The financial sector, often a bastion of stability, is now caught in the crosshairs of macroeconomic shifts and changing investor sentiments. With the broader market, represented by the S&P 500 and NASDAQ-100, showing resilience, XLF's divergence hints at deeper undercurrents affecting the financial sphere. Let's delve into the specifics that have the smart money on high alert.
The S&P 500 and NASDAQ-100 serve as the backdrop to this story, both showing a risk-on sentiment with their upward momentum. A weakened dollar usually acts as a tailwind for equities by enhancing the competitive edge of U.S. corporations abroad. Yet, this very weakness, coupled with rising bond yields, introduces a conundrum for financials. Higher yields typically increase banks' net interest margins, yet the current climate suggests inflation concerns and capital cost pressures that cannot be ignored.
WHY XLF ETF IS MOVING TODAY
Today's substantial move in the XLF ETF, a drop of 3.19%, is driven by a confluence of factors within the financial sector. The primary assets under the XLF umbrella include major banking, insurance, and financial services companies. Notably, today's slump contrasts sharply with the broader market's upward trend, suggesting a sector-specific disturbance rather than a general market malaise.
The macroeconomic backdrop underscores the complexity of today's move: a softening dollar juxtaposed against climbing bond yields. Such a dynamic, while beneficial in certain contexts, can unsettle financial stocks by hinting at potential inflationary pressures and heightened costs of borrowing. Moreover, this move could be a precursor to broader market shifts if interest rate expectations recalibrate further.
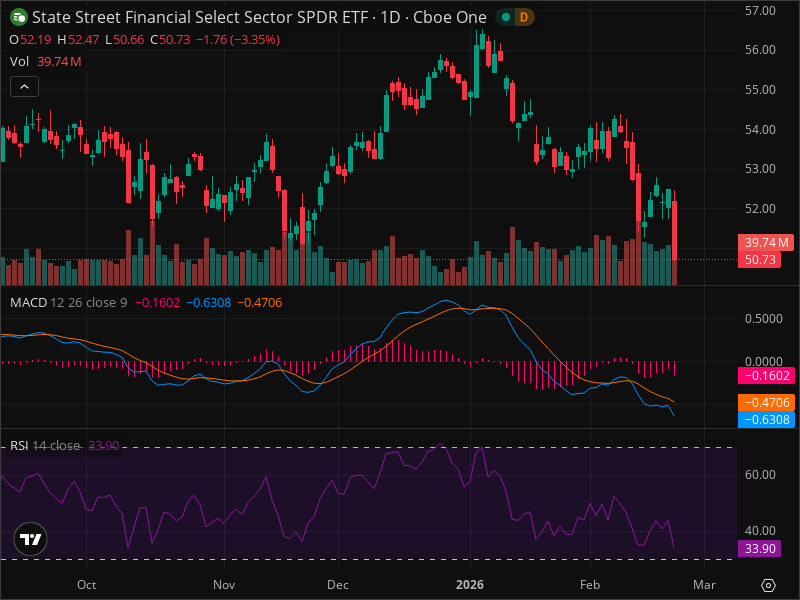
Key levels to watch in XLF now hinge on its immediate support at $50.50, with subsequent levels at $49.00 and $47.50 as strategic defenses. Resistance looms at $52.00, $54.00, and the more formidable $56.00 to $57.00 range. Today's breach of previous supports accentuates the urgency of this situation.
THE CURRENT SETUP
The technical landscape for XLF paints a vivid picture. Currently priced around $50.73, the ETF finds itself grappling with a short-term bearish trend. Today's bearish candle wiped out earlier gains, signaling intense selling pressure. Smart investors are tapping into AI-powered analysis tools to spot these patterns early, such as those offered by InteractiveCrypto Pro.
Fibonacci retracements suggest possible rebounds at $51.50, $52.50, and $53.50, yet without historical data, these are mere waypoints rather than destinations. In the absence of clear graphical patterns, the XLF remains a puzzle demanding a wider historical lens for interpretation.
TECHNICAL DEEP DIVE
This session's technical indicators present a complex, yet navigable, terrain. The RSI reading of 33.90 signals an oversold condition, a classic precursor to a potential rebound. However, the MACD remains resolutely bearish, with its lines trailing below the zero axis—a testament to prevailing downward momentum. These indicators, when aligned with real-time alerts from AI-powered platforms like InteractiveCrypto Pro, could offer crucial insights.
Support, resistance, and Fibonacci levels form the bedrock of this analysis. The $50.50 support line acts precariously as a minor bulwark against further declines, while a psychological line at $49.00 and a significant historical support at $47.50 mark deeper defenses. Resistance at $52.00, $54.00, and a major ceiling at $56.00-$57.00, if breached, could herald a change in fortune.
THE THREE SCENARIOS
Scenario analysis reveals three potential paths: bullish, bearish, and neutral. The bullish scenario, albeit with a modest 30% probability, depends on market stabilization and sector-specific positive data, targeting $54.00 and $56.00. The bearish scenario, more likely with a 50% probability, anticipates continued sector weakness and a break below $50.50, aiming for $49.00 and $47.50. A neutral outcome, with a 20% chance, envisions a period of consolidation between $50.50 and $52.00.
TRADING STRATEGY
For those poised to act, the strategy pivots on a sell recommendation in the short term, with an entry zone between $51.50 and $52.00. The defined risk is a stop loss at $52.50, while potential rewards are plotted at $50.50 and $49.00, offering a risk/reward ratio of 1:3.05. As always, before entering any position, consider using AI analysis tools to confirm your thesis.
RISK FACTORS
The landscape is fraught with risks. A potential market rebound could undercut short positions, while negative sector-specific developments or unexpected interest rate changes could exacerbate volatility. Position sizing, therefore, is crucial—recommendations suggest maintaining exposure to 1-2% of total capital.
THE BOTTOM LINE
In conclusion, XLF represents a challenging yet potentially rewarding opportunity within the financial sector. For ongoing XLF analysis with AI-powered signals, check out InteractiveCrypto Pro. This period demands vigilance, as technical setups evolve amidst broader economic forces. Traders should remain nimble, ready to pivot as new data emerges.
KEY TAKEAWAYS
- XLF down 3.19%, diverging from broader market trends.
- RSI at 33.90 indicates oversold, yet MACD remains bearish.
- Support at $50.50, resistance at $52.00 and $54.00.
- Short-term sell with entry at $51.50-$52.00, targeting $49.00.
- Risk/reward stands at 1:3.05.
- Bearish scenario holds 50% probability, bullish at 30%.
- Market regime risk-on but financials face sector-specific pressures.
- Use AI-powered tools for real-time analysis and alerts.
FINAL VERDICT
| Decision | Value |
|---|---|
| ACTION | SELL |
| Confidence Level | 75% |
| Entry Price | $51.50 - $52.00 |
| Stop Loss | $52.50 |
| Take Profit | $49.00 |
| Risk/Reward | 1:3.05 |
| Success Probability | 50% |
| Timeframe | 1-2 weeks |
WHY THIS TRADE: The tactical alignment of overbought RSI signals with bearish MACD momentum suggests further downside potential.
WHAT MUST HAPPEN: A break and sustained close below the $50.50 support level would validate the bearish thesis, while a move above $52.50 would negate it.
FAQ
SOURCES & REFERENCES
Motley Fool: "Forget 1:1 Returns: The Double-Leveraged Secret to Outperforming the S&P Financials" - Read more
Benzinga: "Druckenmiller's Samba Strategy: Billionaire Buys Into Brazil, Out Of Big Tech" - Read more
GET AN EDGE WITH AI ANALYSIS
Tired of missing big moves? InteractiveCrypto Pro uses artificial intelligence to analyze stocks and crypto 24/7.
What you get:
- AI-Powered Signals with 94% historical accuracy
- Real-time Fair Value estimates
- 40+ technical indicators analyzed automatically
- Instant alerts when key levels are hit
LIMITED TIME: 50% OFF - Plans from just $6.49/month
Start Your Free Analysis Now →
Ready to Trade XLF Like a Pro?
InteractiveCrypto Pro gives you the edge with:
- AI-Powered Signals - 94% accuracy
- Real-time Fair Value Estimates
- 40+ Technical Indicators
- Instant alerts on key levels
50% OFF - Just $6.49/month
Compare Your Options:
Compare trading platforms to find the best tools for your strategy.


.png)
.png)
.png)


COMMENTS (0)