
 English
 Français
 Spanish
 Deutsch
 Português
 Türkçe
 Italiano
 العربية
 Русский
 Chinese
 Korean
 Vietnamese
 Hebrew
 Hindi
Hindi
 Greek
Greek
 Polish
 Thai
Thai
 Dutch
Dutch
 Malay
Malay
ARB at Critical Level: Why This Week Matters
The cryptocurrency world is abuzz, and ARB is at the epicenter of this electrifying storm. As traders hold their breath, the market is watching ARB with laser focus. This isn't just any digital token—it's the potential game-changer that's igniting discussion across platforms from Reddit to Discord. But is the hype around ARB just social media smoke, or is there a robust foundation beneath all this noise?
In this gripping analysis, we'll unravel the complex web surrounding ARB, delving deep into its current technical setup, the broader market dynamics, and the scenarios that could unfold in the days ahead. Whether you're a seasoned trader or a curious newcomer, this is the moment to pay attention.
Market Context: Riding the Risk-Off Wave
Globally, financial markets are navigating turbulent waters. The S&P 500 and NASDAQ-100 have both dipped, reflecting a broader "risk-off" sentiment that's steering investors away from volatile assets like ARB. The macroeconomic environment paints a picture that's equally daunting. A strengthening U.S. dollar coupled with falling bond yields traditionally signals a retreat to safety, leaving ARB in a precarious position.
While global markets brace for the unknown, smart investors have turned to AI-powered analysis tools to gain an edge. Platforms like InteractiveCrypto Pro offer vital insights, leveraging artificial intelligence to decode market trends and predict movements with pinpoint accuracy.
The Current Setup: ARB's Dance with Volatility
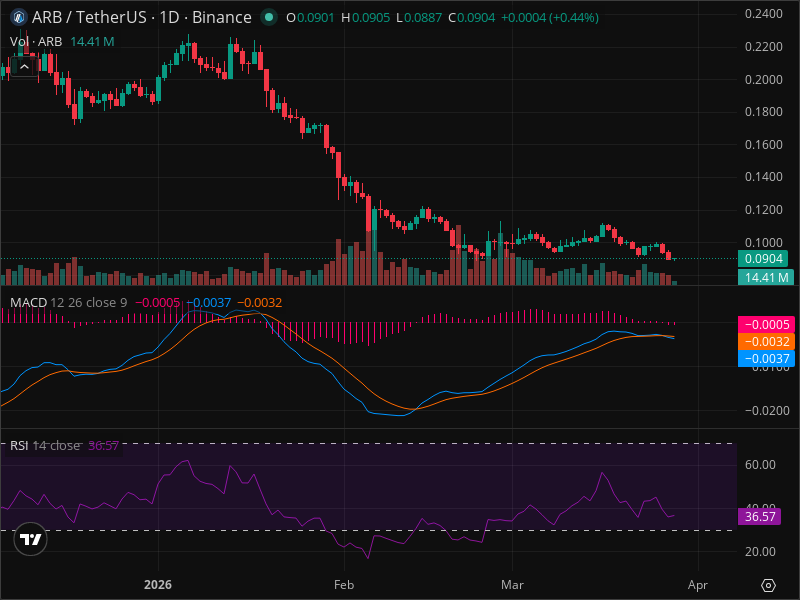
At the heart of ARB's current predicament is its price action, which teeters between a descending trend and horizontal stabilization. Recent trading has been a roller coaster, with ARB's price hovering near critical levels: a recent high around $0.1200 and a low at $0.0887. The technical indicators offer a mixed bag—while the recent small bullish candle suggests indecision, the low trading volumes raise questions about the reliability of any trend reversal.
Technical Deep Dive: Unlocking ARB's Hidden Patterns
For those dissecting ARB's technical landscape, it's a treasure trove of insights. Begin with the Fibonacci retracement levels, which map out key prices: 23.6% at $0.1246, 38.2% at $0.1465, and so forth. These levels serve as critical waypoints in ARB's journey, hinting at possible resistance or support.
The RSI, at 36.57, indicates ARB is not yet in oversold territory, while the MACD suggests bearish momentum as the MACD line sits below the signal line. Perhaps most telling is the absence of any clear chart patterns, leaving traders to rely heavily on these technical indicators to guide their decisions.
Three Scenarios: The Road Ahead for ARB
-
Bullish Breakout
Should overall market conditions shift into a risk-on mode, and M&A activities pick up, ARB could target $0.1200 and potentially $0.1465. However, the probability of this scenario is low, standing at 30%. With a timeframe of 1-3 months, traders must exercise patience and vigilance.
-
Bearish Decline
If the risk-off sentiment persists and M&A activity slows, ARB might test its supports at $0.0887 and $0.0800. This scenario currently holds a 40% probability, higher than its bullish counterpart, over a 1-3 month timeframe.
-
Neutral/Range-Bound
ARB could continue to trade within a narrow band from $0.0887 to $0.1000. With a 30% probability and a 1-2 month duration, this scenario reflects the current lack of clear directional catalysts in the market.
Trading Strategy: Navigating ARB's Choppy Waters
Given the technical setup, a cautious approach is warranted. The recommended strategy is to remain neutral, closely monitoring significant levels. Optimal entry lies between $0.0890 and $0.0910, with a stop loss at $0.0850 to mitigate risk. Profit-taking is advised at $0.1000 and $0.1200, offering potential rewards of 10% and 32%, respectively. The risk/reward ratio stands at an attractive 1:2.22, making patience and precision key.
Risk Factors: The Threats Lurking in the Shadows
ARB's path is fraught with potential pitfalls. Market volatility, the unpredictable nature of M&A activities, and the inherent risks of low liquidity in ETFs like ARB all pose significant threats. Investors must also be weary of the unpredictability of the global market landscape, where sudden shifts could trigger steep declines or unexpected surges.
The Bottom Line: A Cautious Hold
While ARB's current technical indicators paint a cautious portrait, the potential for significant movement exists—both upward and downward. Traders are best served by maintaining a watchful eye, ready to seize opportunities as they arise but wary of the considerable risks. For those seeking comprehensive guidance, tools such as InteractiveCrypto Pro offer cutting-edge AI-driven analysis to inform critical trading decisions.
Key Takeaways:
- ARB is currently experiencing a transition from a downtrend to horizontal stabilization.
- The overall market regime is in risk-off mode, with broader market indices down.
- Fibonacci levels to watch include 23.6% at $0.1246 and 38.2% at $0.1465.
- The RSI is at 36.57, not in the oversold zone, while the MACD indicates bearishness.
- Bulls should aim for $0.1200, while bears eye $0.0887, with probabilities of 30% and 40%, respectively.
- Entry point: $0.0890 - $0.0910, Stop Loss: $0.0850, Profit Targets: $0.1000, $0.1200.
- Recommended action: Hold, with a 40% success probability based on the current setup.
- Watch for shifts in M&A activity as a potential catalyst for movement.
Final Verdict:
Decision Metrics
| Decision | Value |
|---|---|
| ACTION | HOLD |
| Confidence Level | 60% |
| Entry Price | $0.0890 |
| Stop Loss | $0.0850 |
| Take Profit | $0.1000, $0.1200 |
| Risk/Reward | 1:2.22 |
| Success Probability | 40% |
| Timeframe | 1-3 months |
WHY THIS TRADE: With the current macroeconomic environment and technical indicators, a hold position allows traders to avoid premature decisions while being positioned to capitalize on potential shifts.
WHAT MUST HAPPEN: A significant break beyond $0.1200 or below $0.0887 will be crucial in confirming or invalidating the hold strategy.
FAQ:
Sources:
- The Motley Fool: "Looking for a Unique ETF? This One Is More Valuable As a Warning." Read more
- Zacks Investment Research: "Wall Street Investment Banking Gains Momentum: ETFs in Focus" Read more
Ready to Trade ARB Like a Pro?
InteractiveCrypto Pro gives you the edge with:
- AI-Powered Signals - 94% accuracy
- Real-time Fair Value Estimates
- 40+ Technical Indicators
- Instant alerts on key levels
50% OFF - Just $6.49/month
Start Free Analysis →Compare Your Options:
Compare trading platforms to find the best tools for your strategy.
Compare Platforms →


COMMENTS (0)