
 English
 Français
 Spanish
 Deutsch
 Português
 Türkçe
 Italiano
 العربية
 Русский
 Chinese
 Korean
 Vietnamese
 Hebrew
 Hindi
Hindi
 Greek
Greek
 Polish
 Thai
Thai
 Dutch
Dutch
 Malay
Malay
MSFT at Critical Level: Why This Week Matters More Than Ever
Microsoft (MSFT), a titan of the tech industry, stands at a precipice. As the market teeters between bullish enthusiasm and bearish caution, MSFT's stock is caught in a complex web of technical signals that could lead to a significant shift. The information coming in is both hopeful and cautionary, forcing investors to pay close attention. The question is: Will MSFT defy the odds and pivot upward, or are we on the brink of a deeper correction?
In the world of stock trading, timing and precision are paramount. Financial markets are in a risk-on mode, with indices like the S&P 500 (SPY) and Nasdaq 100 (QQQ) showing upward momentum. Yet, MSFT has been lagging slightly behind these broader movements, hinting at an underlying tension. But here's where it gets interesting—today's trading session brought a promising sign: a strong bullish candlestick that could signal a potential reversal.
The macroeconomic backdrop adds another layer of complexity. A strengthening dollar typically weighs down U.S. multinationals, but the current risk-on environment might counteract this effect. Although rising bond yields often pose a challenge for growth stocks, MSFT's status as a high-quality stock could mitigate such impacts. This intricate dance of market forces makes the technical setup even more significant and timely.
Microsoft's recent price action tells a story of resilience and potential. Despite being in a short-term downtrend, today's bullish candlestick presents a glimmer of hope for a reversal. The stock is testing critical Fibonacci retracement levels, and trading volume remains average—neither confirming nor refuting the bullish momentum. Smart investors are using AI-powered analysis tools to spot these patterns early and adapt their strategies accordingly.
Technical Analysis: Key Levels and Indicators
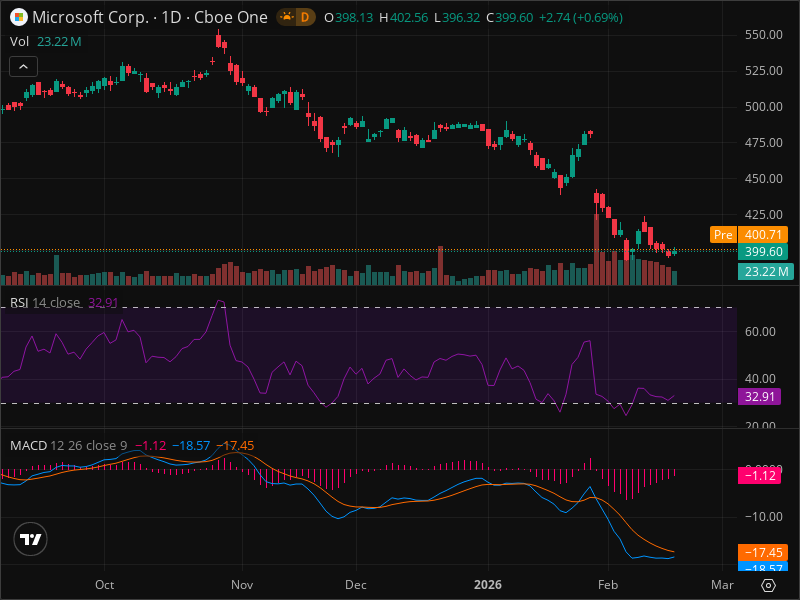
Diving deeper into the technical analysis, we find a tableau of important metrics that could determine MSFT's trajectory. The stock's recent highs around $425 and lows near $390 set the stage for a potential breakout or breakdown. Fibonacci retracement levels are being keenly observed, with the 23.6% level at approximately $398 currently under scrutiny. A breakthrough at the 38.2% level ($403) could affirm a bullish trend, while failing to hold $390 could trigger a bearish move.
The technical indicators paint a nuanced picture. The RSI (Relative Strength Index) at 32.91 suggests that MSFT is in oversold territory, indicating a possible rebound. Meanwhile, the MACD (Moving Average Convergence Divergence) presents a different story with bearish signals. Yet, the shrinking histogram hints at weakening downward momentum. Traders who rely on these signals might already be strategizing their next move.
Potential Scenarios
MSFT currently illustrates three potential scenarios based on the data:
- Bullish Scenario: MSFT surpasses the $403 resistance with increased trading volume, targeting $412 and potentially $425. The probability of this scenario lies at 40%.
- Bearish Scenario: MSFT dips below the $390 support, with increased volume pushing it towards $380 or $370. This scenario carries a 30% probability.
- Neutral Scenario: The stock remains in a tight range between $390 and $403, representing a 30% likelihood over the next one to two weeks.
Trading Strategy
For traders looking to capitalize on these developments, a strategic approach is essential. The recommended action is a conditional buy between $396 and $401, with a stop loss set at $388 to manage risk. The first target for profit-taking stands at $412, followed by a more ambitious $425, offering a risk-to-reward ratio of 1:2.33. Before entering any position, consider using AI analysis tools to confirm your thesis and stay updated with real-time alerts.
However, every opportunity comes with risks. The broader market's potential for a correction, unexpected negative developments in the tech sector, or unforeseen earnings outcomes could derail even the most promising setups. It's prudent to limit exposure to 2-3% of your portfolio to manage these risks effectively.
The bottom line? Microsoft offers a compelling yet cautious buy opportunity. With RSI indicating oversold conditions and the potential for a breakout from a descending wedge pattern, the technical setup is promising but requires careful monitoring.
Key Takeaways
- Market Regime: Risk-on, supportive of bullish moves.
- Key Levels: Watch for breaks above $403 or below $390.
- Fibonacci Insights: Testing at 23.6% retracement near $398.
- Trading Volume: Average, not yet confirming a strong trend.
- Indicators: RSI at 32.91 signals oversold, MACD shows bearish yet weakening momentum.
- Scenarios: Bullish (40%), Bearish (30%), Neutral (30%).
- Trading Strategy: Buy, with entry at $396-401, stop at $388, targets at $412 and $425.
- Risk Factors: Market corrections, tech sector news, unexpected earnings.
- Portfolio Exposure: Limit to 2-3%.
FINAL VERDICT
Actionable Recommendation:
- ACTION: BUY
- Confidence Level: 70%
- Entry Price: $398
- Stop Loss: $388
- Take Profit: $425
- Risk/Reward: 1:2.33
- Success Probability: 40%
- Timeframe: 2 weeks
WHY THIS TRADE: The RSI indicates oversold conditions, aligning with the potential breakout from a descending wedge pattern. This confluence suggests a meaningful potential reversal.
WHAT MUST HAPPEN: MSFT needs to close above $403 with increasing volume to confirm the bullish scenario.
FAQ
Sources
- Investing.com: This 8.2% Dividend Is a Smart Play on ’AI Panic 2.0’ - Read more
- The Motley Fool: Meet the Brilliant Vanguard ETF With 45.3% of Its Portfolio Invested in Nvidia, Apple, Microsoft, and Alphabet - Read more
Ready to Trade MSFT Like a Pro?
InteractiveCrypto Pro gives you the edge with:
- AI-Powered Signals - 94% accuracy
- Real-time Fair Value Estimates
- 40+ Technical Indicators
- Instant alerts on key levels
50% OFF - Just $6.49/month
Start Free Analysis →Compare Your Options:
Compare trading platforms to find the best tools for your strategy.
Compare Platforms →"GET AN EDGE WITH AI ANALYSIS"
Tired of missing big moves? InteractiveCrypto Pro uses artificial intelligence to analyze stocks and crypto 24/7.
What you get:
- AI-Powered Signals with 94% historical accuracy
- Real-time Fair Value estimates
- 40+ technical indicators analyzed automatically
- Instant alerts when key levels are hit
LIMITED TIME: 50% OFF - Plans from just $6.49/month
Start Your Free Analysis Now →


COMMENTS (0)