Create a FREE account and...
Manage your own Watchlist
Access all education lessons
Converse with other crypto enthusiasts
Be a part of the Interactive Crypto Community
OR
Please fill out the required fields Please fill out the required fields Please fill out the required fields

As of March 9, 2026, the financial world is grappling with a seismic shake-up: Bitcoin has plummeted below the $66,000 threshold, trading at $66,016 after a 1.86% drop in just 24 hours, while oil prices have skyrocketed by nearly 20%. This unexpected convergence of crypto volatility and traditional market turbulence is sending shockwaves through investment portfolios. Why does this matter to you? Whether you’re a seasoned crypto trader or a cautious observer, these developments could reshape your financial strategy, hinting at broader economic uncertainties and potential opportunities on the horizon.
This isn’t just about numbers on a screen—it’s about understanding the forces driving markets and positioning yourself for what’s next. Could Bitcoin’s dip signal a buying opportunity, or is it a warning of deeper declines? And how does oil’s explosive surge factor into the equation? Stick with me as we unpack this complex landscape, offering insights and data-driven analysis to help you navigate these choppy waters. If you’re looking for an edge, consider tapping into AI-powered insights to stay ahead of the curve.
The cryptocurrency market is in a state of flux. Bitcoin, the bellwether of digital assets, has seen its value erode to $66,016, reflecting a 1.86% decline over the past 24 hours, according to CoinGecko data. Ethereum isn’t faring much better, slipping 1.67% to $1,936.88. Meanwhile, the Fear & Greed Index, a widely watched sentiment gauge from Alternative.me, sits at a chilling 8, signaling “Extreme Fear” among investors.
But the crypto downturn isn’t happening in isolation. Oil prices have surged by nearly 20%, driven by geopolitical tensions disrupting supply chains, as reported by Bloomberg. This dramatic spike is raising concerns about inflation and economic stability, potentially pushing investors away from riskier assets like cryptocurrencies and toward traditional safe havens.
What’s behind Bitcoin’s stumble? Analysts point to a combination of profit-taking after recent highs and broader market uncertainty fueled by oil’s rally. The total crypto market capitalization, currently at $2.35 trillion, remains dominated by Bitcoin at 56.24%, but even this titan isn’t immune to external pressures. These developments beg the question: are we witnessing a temporary blip or the start of a prolonged correction?
If you’re an investor, these dual shocks—Bitcoin’s drop and oil’s surge—demand your attention. The immediate implication is heightened volatility across asset classes. With the Fear & Greed Index at “Extreme Fear,” panic selling could exacerbate crypto declines, potentially dragging Bitcoin lower if sentiment doesn’t recover.
On the flip side, some see opportunity in chaos. Historically, Bitcoin has rebounded from oversold conditions, and a drop to $66,000 might tempt long-term holders to buy the dip. But caution is key—oil’s 20% surge could signal rising inflation, which often tightens liquidity and curbs risk appetite. Diversifying your portfolio and keeping a close eye on macroeconomic trends is more critical than ever.
Wondering how to assess Bitcoin’s next move? Tools like AI price predictions can offer data-driven clarity amid the noise. For now, focus on risk management—avoid over-leveraging and consider setting stop-loss orders to protect your capital in this uncertain environment.
Bitcoin’s latest tumble below $66,000 isn’t just a random event—it’s the culmination of several overlapping factors. Investor sentiment has soured, as evidenced by the Fear & Greed Index’s dire reading of 8. This extreme fear often triggers a self-fulfilling prophecy: panicked investors sell, driving prices lower and fueling further fear.
Simultaneously, the traditional markets are sending distress signals of their own. Oil’s near-20% price surge, fueled by geopolitical instability in key producing regions, is a stark reminder of how interconnected global markets are. As Bloomberg reports, supply chain disruptions have tightened oil availability, pushing prices to levels not seen in months. This surge could stoke inflation fears, prompting central banks to tighten monetary policy—a move that historically dampens enthusiasm for speculative assets like cryptocurrencies.
The interplay between oil and crypto is more significant than it might appear. Rising energy costs impact everything from consumer spending to corporate profits, often leading investors to reassess risk. While some argue that Bitcoin could serve as a hedge against inflation, the current market mood suggests otherwise, with capital flowing out of digital assets. Understanding this broader context is crucial for anticipating where Bitcoin and its peers might head next.

BTC Crypto Chart
Industry voices are weighing in on this turbulent moment. Michael Saylor, CEO of MicroStrategy and a prominent Bitcoin advocate, recently suggested on social media that volatility is inherent to transformative assets like Bitcoin, urging investors to focus on long-term value. His perspective aligns with a growing cohort of institutional players who view dips as entry points.
Meanwhile, analysts at JPMorgan have cautioned that oil’s rally could have a cascading effect on risk assets. According to a recent report, “Sustained high energy prices may constrain liquidity in markets like cryptocurrencies, where retail and speculative capital dominate.” This view underscores the fragility of the current crypto landscape, where external shocks can quickly alter trajectories.
The industry impact is palpable. Crypto exchanges are reporting higher trading volumes as investors react to price movements, but the net flow of funds appears to be outward, signaling caution. For businesses reliant on blockchain technology, the focus may shift toward efficiency and cost-cutting if market conditions worsen.
From a financial standpoint, the immediate risks are clear. Bitcoin’s drop to $66,016, combined with Ethereum’s slide to $1,936.88, suggests potential for further downside if selling pressure persists. Oil’s surge adds another layer of complexity, as higher energy costs could squeeze disposable income, reducing retail investment in crypto.
Yet, there’s a silver lining for the patient investor. Bitcoin’s historical resilience—rebounding from past bear markets to new highs—offers hope. Institutional adoption continues to grow, with companies like Tesla and Square maintaining significant crypto holdings. If you’re considering an entry point, now might be the time to explore AI signals for Bitcoin to guide your decisions.
Strategically, diversification remains paramount. Balancing crypto exposure with stable assets like bonds or gold can mitigate risk. Additionally, keeping an eye on regulatory developments—such as the SEC’s ongoing scrutiny of exchanges—can help you anticipate policy-driven market shifts. For deeper insights, tools offering AI fair value estimates can provide a quantitative edge.
Let’s get into the nitty-gritty of Bitcoin’s price action. At $66,016, Bitcoin is testing a critical support level. The Relative Strength Index (RSI) has dipped into oversold territory at around 28, according to TradingView data, often a precursor to a potential reversal if buying interest emerges.
However, other indicators paint a more cautious picture. The Moving Average Convergence Divergence (MACD) shows bearish momentum, with the signal line trending below the MACD line—a sign that sellers still hold the upper hand. The 50-day moving average, currently at $68,500, acts as a key resistance level; a break above could signal a shift in sentiment.
For those crunching the numbers, here’s a snapshot of Bitcoin’s current metrics in a clear comparison table:
| Metric | Current Value | Change (24h) |
|---|---|---|
| Bitcoin Price | $66,016 | -1.86% |
| RSI (14-day) | 28 | Oversold |
| Market Cap | $1.32T | -1.5% |
For a deeper dive into these indicators, consider checking AI analysis for Bitcoin to uncover hidden patterns.
Where do we go from here? Short-term forecasts for Bitcoin remain cautious. If the Fear & Greed Index stays in “Extreme Fear” territory, we could see Bitcoin test lower support levels around $60,000, a psychological barrier for many traders. Analysts at Glassnode suggest that on-chain activity—such as wallet movements and transaction volumes—indicates a wait-and-see approach among large holders, or “whales.”

ETH Crypto Chart
Longer term, the outlook is more optimistic. Blockchain technology continues to evolve, and institutional interest shows no signs of waning. A report from CoinDesk highlights that over 60% of surveyed hedge funds plan to increase crypto allocations by 2027, even amidst current volatility. If oil prices stabilize, risk appetite could return, potentially pushing Bitcoin back toward $80,000 by mid-2026.
Of course, predictions are not guarantees. External factors like central bank policies and geopolitical events will play a role. For a more granular forecast, tools offering AI price predictions can help refine your expectations.
Bitcoin’s decline to $66,016 as of March 9, 2026, is driven by a mix of investor fear, profit-taking, and broader market uncertainty. The Fear & Greed Index at 8 reflects extreme caution, while external factors like oil’s 20% price surge are dampening risk appetite.
Oil’s dramatic 20% price increase raises inflation concerns and could lead to tighter monetary policies, reducing liquidity for speculative assets like cryptocurrencies. It also signals economic instability, often pushing investors toward safer investments.
It depends on your risk tolerance and investment horizon. Technical indicators like an oversold RSI suggest a potential rebound, but bearish momentum persists. For a data-driven perspective, consider exploring AI signals for Bitcoin.
Despite short-term volatility, Bitcoin’s long-term outlook remains bullish due to growing institutional adoption and blockchain advancements. Analysts predict a potential return to $80,000 if market conditions stabilize.
Diversification is key—balance crypto holdings with stable assets like bonds or gold. Set stop-loss orders to limit downside risk, and stay informed on macroeconomic trends like oil prices and regulatory news.
Yes, advanced platforms can provide clarity. For instance, you can get professional AI analysis to access buy/sell signals, fair value estimates, and risk assessments tailored to current market dynamics.
TITLE: Bitcoin tumbles below $66,000 as oil prices explode nearly 20% higher
STYLE: Professional Financial Article - Focus on data presentation with clean tables - Include market analysis sections - Use clear headings for financial concepts - Present data in easy-to-read format - Include key takeaways and summary sections


ALL
TRENDING
WATCHLIST
Total Market Cap The Total Market Capitalization (Market Cap) is an indicator that measures the size of all the cryptocurrencies.It’s the total market value of all the cryptocurrencies' circulating supply: so it’s the total value of all the coins that have been mined.
{[{ marketcap }]} {[{ marketcapchange.toLocaleString(undefined, {maximumFractionDigits:2}) }]}% (24H) {[{ marketcapchange.toLocaleString(undefined, {maximumFractionDigits:2}) }]}% (24H)
Symbol
Price Cryptocurrency prices are volatile, and the prices change all the time. We are collecting all the data from several exchanges to provide the most accurate price available.
24H Cryptocurrency prices are volatile… The 24h % change is the difference between the current price and the price24 hours ago.
Trade
{[{ item.name }]}
{[{ index + $index}]}
{[{ item.pair.split('_')[0] }]}
Ƀ{[{item.price.toLocaleString(undefined, {maximumFractionDigits: 5}) }]} ${[{item.price.toLocaleString(undefined, {maximumFractionDigits: 5}) }]}
{[{ item.change24.toLocaleString(undefined, {maximumFractionDigits: 2}) }]}%
{[{ item.change24.toLocaleString(undefined, {maximumFractionDigits: 2}) }]}%
Symbol
Price Cryptocurrency prices are volatile, and the prices change all the time. We are collecting allthe data fromseveral exchanges to provide the most accurate price available.
24H Cryptocurrency prices are volatile… The 24h % change is the difference between the current priceand the price24 hours ago.
Trade
{[{ item.name }]}
{[{ index + $index}]}
{[{ item.pair.split('_')[0] }]}
Ƀ{[{item.price.toLocaleString(undefined, {maximumFractionDigits: 5}) }]} ${[{item.price.toLocaleString(undefined, {maximumFractionDigits: 5}) }]}
{[{ item.change24.toLocaleString(undefined, {maximumFractionDigits: 2}) }]}%
{[{ item.change24.toLocaleString(undefined, {maximumFractionDigits: 2}) }]}%


BTC Technical Analysis
May 27, 2026 | Joanna Newman

Soybeans Technical Analysis
May 27, 2026 | Joanna Newman
Live Cattle Technical Analysis
May 27, 2026 | Joanna Newman

DJI Technical Analysis
May 27, 2026 | Joanna Newman
Tezos (XTZ) Review 2024: Everything You Need to Know Before Buying Tezos
.article-container { font-family: Arial, sans-serif; line-height: 1.6; color: #333; backgrou...
Chromia (CHR) Review 2024: Everything You Need to Know Before Buying Chromia
Illuvium (ILV) Review 2024: Everything You Need to Know Before Buying Illuvium
My Neighbor Alice (ALICE) Review 2024: Everything You Need to Know Before Buying My Neighbor Alice
Star Atlas (ATLAS) Review 2024: Everything You Need to Know Before Buying Star Atlas
TabTrade
What Is TabTrade? A Complete IntroductionTabTrade is a globally oriented multi-asset CFD and forex b...
Funded7
In the fast-moving world of proprietary trading, 2026 has marked a significant shift in what traders...
Bullwaves
Bullwaves Review 2026: A Premium MT5 Brokerage for Multi-Asset TradersBullwaves has quickly carved o...
BlackBull Markets
...
OQtima
Oqtima is an emerging online trading platform that offers a wide range of financial instruments, inc...
(adsbygoogle = window.adsbygoogle || []).push({}); Introduction In t...
(adsbygoogle = window.adsbygoogle || []).push({}); Einführung Wenn es um Er...
Mobi
Are you someone who makes international payments regularly using Bitcoin? Or do you travel a lot and...
Bitcoin.com
Bitcoin.com is a free downloadable Bitcoin wallet that allows users to trade and receive Bitcoins. T...
BTC.com
Created by Bitmain in 2016, BTC.com is a leading open-source Bitcoin and Bitcoin Cash storage platfo...
Bitcoin Price Analysis: Why a $66K Drop and Oil’s 20% Surge Could Signal a Major Shift for Investors
/* Modern SEO & AI-Optimized Article Styles */ /* Fonts loaded via link tags in head for b
Ethereum Price Analysis: Why Bitmine Is Slowing Purchases and What This Means for the Crypto Market
/* Modern SEO & AI-Optimized Article Styles */ /* Fonts loaded via link tags in head for b
Crypto Market Update: Why Dogecoin's 7% Surge Signals a Hidden Shift in Investor Sentiment
/* Modern SEO & AI-Optimized Article Styles */ /* Fonts loaded via link tags in head for b
Binance's Zero-Fee Altcoin Play: Could BNB Hit $1,000 by 2026?
/* Modern SEO & AI-Optimized Article Styles */ @import url('https://fonts.googleap
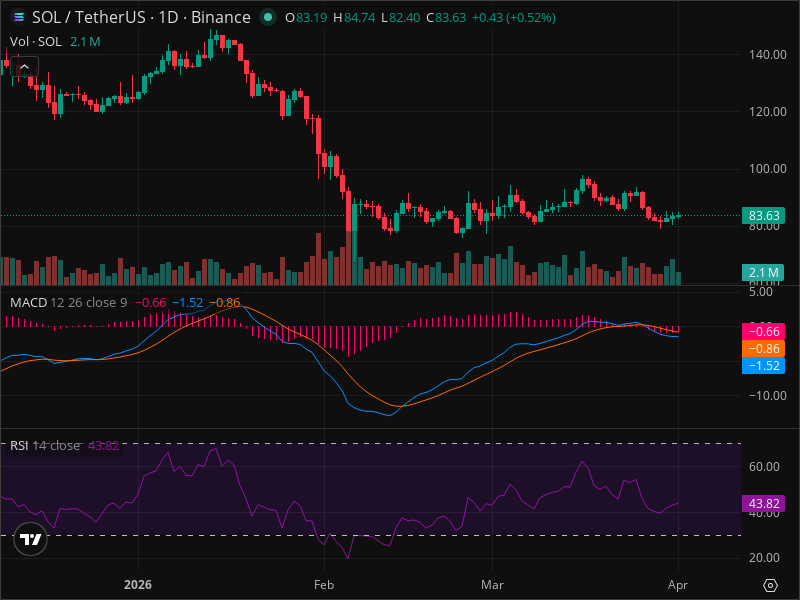
SOL at Critical Level: Why This Week Matters
SOL Chart | TradingView SOL at Critical Level: Why This Week Matters The crypt
The Top 10 Crypto Assets with the Highest Potential in 2025
.article-container { font-family: Arial, sans-serif; line-height: 1.6; color: #333; background-color
The Ultimate Bitcoin Review 2024: Everything You Need to Know Today
.article-container { font-family: Arial, sans-serif; line-height: 1.6; color: #333; background-colo
The Everyday Fruit that's a Powerhouse of Nutrition and Your Weight Loss Ally
(adsbygoogle = window.adsbygoogle || []).push({}); IntroductionWhen it comes to nutrition a
The oldest and most powerful remedy to permanently get rid of insects and ants
(adsbygoogle = window.adsbygoogle || []).push({}); IntroductionEach year, as the hot season
Two Beds, One Dream: The Growing Trend of Sleeping Apart for Better Rest
(adsbygoogle = window.adsbygoogle || []).push({}); IntroductionIn an era where quality slee
(adsbygoogle = window.adsbygoogle || []).push({}); Introduction In t...
(adsbygoogle = window.adsbygoogle || []).push({}); Einführung Wenn es um Er...
Mobi
Are you someone who makes international payments regularly using Bitcoin? Or do you travel a lot and...
Bitcoin.com
Bitcoin.com is a free downloadable Bitcoin wallet that allows users to trade and receive Bitcoins. T...
BTC.com
Created by Bitmain in 2016, BTC.com is a leading open-source Bitcoin and Bitcoin Cash storage platfo...

 Français
 Spanish
 Deutsch
 Português
 Türkçe
 Italiano
 العربية
 Русский
 Chinese
 Korean
 Japanese
 Vietnamese
 Hebrew
 Hindi
Hindi
 Greek
Greek
 Polish
 Thai
Thai
 Dutch
Dutch
 Malay
Malay


.png)
.png)
.png)


COMMENTS (0)