Create a FREE account and...
Manage your own Watchlist
Access all education lessons
Converse with other crypto enthusiasts
Be a part of the Interactive Crypto Community
OR
Please fill out the required fields Please fill out the required fields Please fill out the required fields

Imagine a market so gripped by fear that it’s practically begging for bold investors to step in. As of March 30, 2026, the cryptocurrency landscape is exactly that—a $2.38 trillion arena shadowed by an “Extreme Fear” sentiment, as reflected by a Fear & Greed Index score of just 8. Yet, beneath the surface of this caution lies a potential goldmine for those who know where to look. Whether you’re a seasoned trader or a curious newcomer, this moment could define your financial future—will it be a missed chance or the start of something transformative?
The numbers tell a compelling story: Bitcoin holds steady at $66,570 with a dominance of 56.02%, while Ethereum shows quiet strength with a 0.29% uptick to $2,008.63. But why does this matter to you? Because history whispers that periods of extreme fear often precede massive rallies, and right now, the data suggests we’re on the cusp of something big. Curious about what the future holds? Check the AI analysis to uncover hidden signals in this volatile market.
The crypto market on March 30, 2026, is a paradox of caution and opportunity. With a total market capitalization of $2.38 trillion and a 24-hour trading volume of $63.95 billion, activity persists despite the pervasive fear. Bitcoin, the bellwether of the industry, maintains a robust dominance at 56.02%, trading at $66,570 with a marginal 0.04% increase, according to CoinGecko data.
Ethereum, often seen as the innovative sibling to Bitcoin, isn’t far behind, posting a slight gain of 0.29% to reach $2,008.63. Meanwhile, stablecoins like Tether (USDT) and USD Coin (USDC) hover near their $1 peg, offering a safe harbor in turbulent waters. These figures paint a picture of a market that’s holding its ground, even as sentiment screams caution.
What’s driving this “Extreme Fear” reading of 8 on the Fear & Greed Index? Analysts point to a mix of macroeconomic uncertainty, regulatory murmurs, and recent profit-taking after a volatile year. Yet, for every wave of panic, there’s a countercurrent of opportunity—a notion that’s hard to ignore when you see key assets showing resilience.
For investors, the current market sentiment is a double-edged sword. On one hand, “Extreme Fear” suggests potential bargains as prices dip below intrinsic values. Bitcoin’s stability at $66,570 and Ethereum’s quiet strength could be the foundation for a rebound, especially if historical patterns of fear-to-greed cycles hold true.
On the other hand, fear can be a self-fulfilling prophecy, driving further sell-offs if panic spreads. The key is timing and conviction. If you’re considering a move, now might be the moment to research deeply and act decisively. For data-driven insights, Get AI-powered insights to guide your next steps in this uncertain terrain.
Focus on assets with strong fundamentals—think Bitcoin for its safe-haven status or Ethereum for its DeFi utility. But don’t ignore risk management; allocate only what you can afford to hold through volatility. The $2.38 trillion market cap signals there’s still plenty of capital in play, waiting for the right catalyst.
The Fear & Greed Index, currently at a chilling 8, isn’t just a number—it’s a window into the collective psyche of the crypto market. Compiled from metrics like volatility, market momentum, social media sentiment, and Bitcoin dominance, this index signals when emotions are driving decisions over logic. A score this low hasn’t been seen in months, reminiscent of past bottoms before significant rallies, as reported by Bloomberg.
Why does this matter? Extreme fear often means oversold conditions, where panic selling pushes prices below fair value. It’s a contrarian’s dream, but it demands nerves of steel. Historically, scores under 10 have coincided with turning points—think late 2022, when Bitcoin bottomed out before a 150% surge the following year.

NASDAQ:COIN Daily Stock Chart
Beyond sentiment, broader economic forces are shaping the crypto narrative. Persistent inflation concerns, central bank policy shifts, and geopolitical tensions are casting shadows over risk assets, including cryptocurrencies. Yet, Bitcoin’s role as “digital gold” continues to attract institutional interest as a hedge against fiat devaluation, per a recent CoinDesk analysis.
Regulatory uncertainty also looms large. Whispers of tighter controls in major markets like the U.S. and EU have spooked retail investors, contributing to the fear. But for every challenge, there’s a silver lining—clarity in regulation could ultimately pave the way for mainstream adoption, a long-term boon for the $2.38 trillion market.
Industry leaders are split on what “Extreme Fear” means for crypto’s near-term future. MicroStrategy CEO Michael Saylor, a vocal Bitcoin advocate, recently tweeted that such periods are “the best time to buy,” citing Bitcoin’s enduring value proposition as a store of wealth. His firm’s continued accumulation of BTC, even amidst volatility, underscores this bullish stance.
On the flip side, some analysts caution against blind optimism. A JPMorgan report suggests that without a clear macroeconomic catalyst, crypto could languish in a sideways trend for months. “Fear can feed on itself unless a major demand driver emerges,” noted a senior strategist in the report.
The impact on the broader industry is tangible. DeFi projects and NFT platforms, reliant on Ethereum’s ecosystem, are seeing reduced activity as risk-averse investors pull back. Yet, this slowdown could be a chance for consolidation and innovation—stronger projects may emerge from the ashes of fear. Curious about Ethereum’s trajectory? See AI price prediction for deeper insights.
In a market dominated by fear, undervalued assets are often hiding in plain sight. Bitcoin, at $66,570, may seem pricey, but its dominance and stability suggest it’s a cornerstone for any portfolio. Ethereum, with its slight uptick to $2,008.63, offers exposure to the DeFi and NFT boom—a sector poised for recovery once sentiment shifts.
Altcoins present a riskier but potentially rewarding play. Chainlink (LINK), up 0.76% to $8.54, is a standout due to its critical role in connecting blockchain with real-world data. Polkadot (DOT), gaining 0.74% to $1.27, offers interoperability solutions that could drive future adoption. For a detailed breakdown, View AI signals for Bitcoin and other key assets.
Stablecoins like Tether (USDT) at $0.999120 and USD Coin (USDC) at $0.999744 are more than just safe havens—they’re strategic tools. In times of extreme fear, they allow investors to park capital without exiting the crypto ecosystem, ready to pounce when prices bottom out. Their near-perfect pegs provide liquidity and flexibility, crucial for navigating a $63.95 billion daily trading volume market.
The financial implications are clear: this environment rewards patience and precision. Diversify across core holdings like Bitcoin, growth assets like Ethereum, and tactical stablecoins. But always keep an eye on sentiment shifts—fear doesn’t last forever.
Let’s get into the charts. Bitcoin’s price of $66,570 sits at a critical juncture, testing a key support level around $65,000, a threshold that has held firm in recent months per TradingView data. The Relative Strength Index (RSI) hovers near 40, indicating neither overbought nor oversold conditions—just a tense equilibrium waiting for a spark.
Ethereum’s $2,008.63 price shows similar patterns, with a 50-day moving average acting as resistance near $2,050. A break above could signal bullish momentum, while a drop below $1,950 might trigger further fear-driven selling. Volume analysis also reveals a decline in speculative trading, aligning with the $63.95 billion market-wide figure—a sign of caution.
For altcoins like Chainlink and Polkadot, technicals suggest modest upside. Chainlink’s RSI at 45 and Polkadot’s MACD showing early bullish divergence hint at potential breakout opportunities. Want to dive deeper into these metrics? Check AI fair value estimate for precise data points.
| Asset | Current Price | 24-Hour Change |
|---|---|---|
| Bitcoin (BTC) | $66,570 | +0.04% |
| Ethereum (ETH) | $2,008.63 | +0.29% |
| Chainlink (LINK) | $8.54 | +0.76% |
| Polkadot (DOT) | $1.27 | +0.74% |
What lies ahead for the $2.38 trillion crypto market? If history is any guide, extreme fear often gives way to greed-driven rallies. Analysts at Glassnode predict that Bitcoin could test $80,000 by mid-2026 if macroeconomic conditions stabilize and institutional inflows return. Ethereum, buoyed by ongoing upgrades and DeFi growth, might aim for $2,500 in the same timeframe.
However, risks remain. Regulatory crackdowns or a broader economic downturn could push prices lower before any recovery. The Fear & Greed Index at 8 suggests we’re near a bottom, but timing the exact turn is notoriously tricky. A balanced approach—accumulating gradually while monitoring key indicators—seems prudent.
Altcoins like Chainlink and Polkadot could outperform if niche adoption accelerates, while stablecoins will likely remain anchors of stability. For a forward-looking perspective, See what the AI predicts for major cryptocurrencies over the coming months.
“Extreme Fear,” as indicated by a Fear & Greed Index score of 8, reflects a market sentiment dominated by caution and panic. It often suggests oversold conditions where prices may be undervalued, presenting potential buying opportunities for contrarian investors.
Bitcoin’s current stability at $66,570 and its 56.02% market dominance suggest a strong foundation, even amidst fear. While no one can predict the exact bottom, historical data shows that periods of extreme fear often precede rallies. Research and risk management are crucial before investing.
Stablecoins like Tether (USDT) and USD Coin (USDC), pegged near $1, offer a way to preserve capital without leaving the crypto ecosystem. They provide liquidity for quick moves when opportunities arise, acting as a tactical buffer in volatile times.
Chainlink (LINK) at $8.54 and Polkadot (DOT) at $1.27 have posted gains of 0.76% and 0.74%, respectively, driven by their utility in DeFi and interoperability. They could be worth watching, though they carry higher risk compared to Bitcoin or Ethereum.
For detailed analysis beyond surface-level data, leveraging advanced tools can be a game-changer. Platforms that offer AI-driven signals and fair value estimates can provide clarity in complex markets. Get professional AI analysis to uncover trends and make informed decisions.
While no one can guarantee a recovery, historical patterns suggest that extreme fear often marks a turning point. Factors like institutional adoption, technological advancements, and macroeconomic shifts will play a role. Staying informed and adaptable is key to navigating what’s next.


ALL
TRENDING
WATCHLIST
Total Market Cap The Total Market Capitalization (Market Cap) is an indicator that measures the size of all the cryptocurrencies.It’s the total market value of all the cryptocurrencies' circulating supply: so it’s the total value of all the coins that have been mined.
{[{ marketcap }]} {[{ marketcapchange.toLocaleString(undefined, {maximumFractionDigits:2}) }]}% (24H) {[{ marketcapchange.toLocaleString(undefined, {maximumFractionDigits:2}) }]}% (24H)
Symbol
Price Cryptocurrency prices are volatile, and the prices change all the time. We are collecting all the data from several exchanges to provide the most accurate price available.
24H Cryptocurrency prices are volatile… The 24h % change is the difference between the current price and the price24 hours ago.
Trade
{[{ item.name }]}
{[{ index + $index}]}
{[{ item.pair.split('_')[0] }]}
Ƀ{[{item.price.toLocaleString(undefined, {maximumFractionDigits: 5}) }]} ${[{item.price.toLocaleString(undefined, {maximumFractionDigits: 5}) }]}
{[{ item.change24.toLocaleString(undefined, {maximumFractionDigits: 2}) }]}%
{[{ item.change24.toLocaleString(undefined, {maximumFractionDigits: 2}) }]}%
Symbol
Price Cryptocurrency prices are volatile, and the prices change all the time. We are collecting allthe data fromseveral exchanges to provide the most accurate price available.
24H Cryptocurrency prices are volatile… The 24h % change is the difference between the current priceand the price24 hours ago.
Trade
{[{ item.name }]}
{[{ index + $index}]}
{[{ item.pair.split('_')[0] }]}
Ƀ{[{item.price.toLocaleString(undefined, {maximumFractionDigits: 5}) }]} ${[{item.price.toLocaleString(undefined, {maximumFractionDigits: 5}) }]}
{[{ item.change24.toLocaleString(undefined, {maximumFractionDigits: 2}) }]}%
{[{ item.change24.toLocaleString(undefined, {maximumFractionDigits: 2}) }]}%


BTC Technical Analysis
May 27, 2026 | Joanna Newman

Soybeans Technical Analysis
May 27, 2026 | Joanna Newman
Live Cattle Technical Analysis
May 27, 2026 | Joanna Newman

DJI Technical Analysis
May 27, 2026 | Joanna Newman
Tezos (XTZ) Review 2024: Everything You Need to Know Before Buying Tezos
.article-container { font-family: Arial, sans-serif; line-height: 1.6; color: #333; backgrou...
Chromia (CHR) Review 2024: Everything You Need to Know Before Buying Chromia
Illuvium (ILV) Review 2024: Everything You Need to Know Before Buying Illuvium
My Neighbor Alice (ALICE) Review 2024: Everything You Need to Know Before Buying My Neighbor Alice
Star Atlas (ATLAS) Review 2024: Everything You Need to Know Before Buying Star Atlas
TabTrade
What Is TabTrade? A Complete IntroductionTabTrade is a globally oriented multi-asset CFD and forex b...
Funded7
In the fast-moving world of proprietary trading, 2026 has marked a significant shift in what traders...
Bullwaves
Bullwaves Review 2026: A Premium MT5 Brokerage for Multi-Asset TradersBullwaves has quickly carved o...
BlackBull Markets
...
OQtima
Oqtima is an emerging online trading platform that offers a wide range of financial instruments, inc...
(adsbygoogle = window.adsbygoogle || []).push({}); Introduction In t...
(adsbygoogle = window.adsbygoogle || []).push({}); Einführung Wenn es um Er...
Mobi
Are you someone who makes international payments regularly using Bitcoin? Or do you travel a lot and...
Bitcoin.com
Bitcoin.com is a free downloadable Bitcoin wallet that allows users to trade and receive Bitcoins. T...
BTC.com
Created by Bitmain in 2016, BTC.com is a leading open-source Bitcoin and Bitcoin Cash storage platfo...
Crypto Market Update: Why Extreme Fear Could Be the $2.38 Trillion Opportunity Everyone’s Missing
/* Modern SEO & AI-Optimized Article Styles */ /* Fonts loaded via link tags in head for b
Turkey's BRICS Ambition: How China’s Support Could Transform Crypto Markets
/* Modern SEO & AI-Optimized Article Styles */ /* Fonts loaded via link tags in head for b
Top Cryptocurrency Investment Mistakes and How to Avoid Them in 2024
.article-container { font-family: Arial, sans-serif; line-height: 1.6; color: #333; background-col
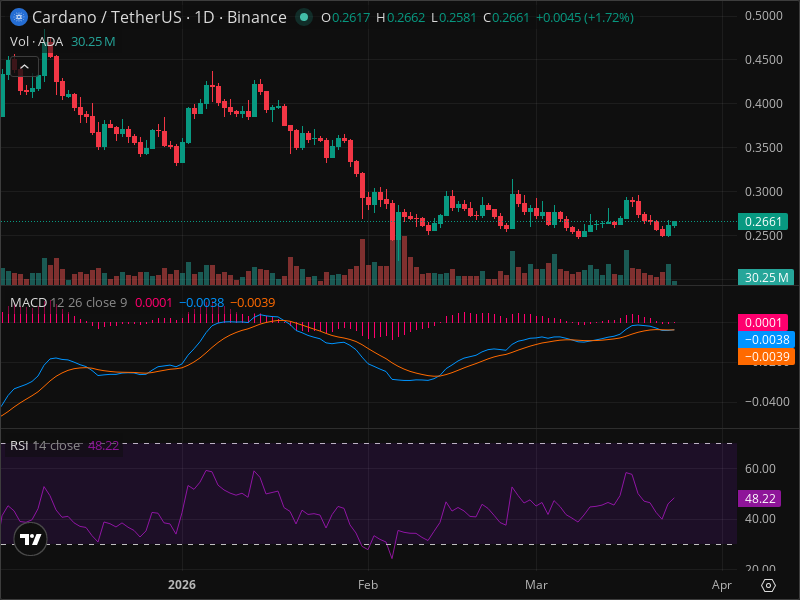
ADA's Pullback Creates Rare Entry Point - Technical Analysis
ADA Chart | TradingView ADA's Pullback Creates Rare Entry Point - Technical Analy
Advantages of Ethereum
As we have seen, the ethereum was presented by Vitalik Buterin in 2014 and has since attracted incre
The Top 10 Crypto Assets with the Highest Potential in 2025
.article-container { font-family: Arial, sans-serif; line-height: 1.6; color: #333; background-color
The Ultimate Bitcoin Review 2024: Everything You Need to Know Today
.article-container { font-family: Arial, sans-serif; line-height: 1.6; color: #333; background-colo
The Everyday Fruit that's a Powerhouse of Nutrition and Your Weight Loss Ally
(adsbygoogle = window.adsbygoogle || []).push({}); IntroductionWhen it comes to nutrition a
The oldest and most powerful remedy to permanently get rid of insects and ants
(adsbygoogle = window.adsbygoogle || []).push({}); IntroductionEach year, as the hot season
Two Beds, One Dream: The Growing Trend of Sleeping Apart for Better Rest
(adsbygoogle = window.adsbygoogle || []).push({}); IntroductionIn an era where quality slee
(adsbygoogle = window.adsbygoogle || []).push({}); Introduction In t...
(adsbygoogle = window.adsbygoogle || []).push({}); Einführung Wenn es um Er...
Mobi
Are you someone who makes international payments regularly using Bitcoin? Or do you travel a lot and...
Bitcoin.com
Bitcoin.com is a free downloadable Bitcoin wallet that allows users to trade and receive Bitcoins. T...
BTC.com
Created by Bitmain in 2016, BTC.com is a leading open-source Bitcoin and Bitcoin Cash storage platfo...

 Français
 Spanish
 Deutsch
 Português
 Türkçe
 Italiano
 العربية
 Русский
 Chinese
 Korean
 Japanese
 Vietnamese
 Hebrew
 Hindi
Hindi
 Greek
Greek
 Polish
 Thai
Thai
 Dutch
Dutch
 Malay
Malay


.png)
.png)
.png)


COMMENTS (0)