Create a FREE account and...
Manage your own Watchlist
Access all education lessons
Converse with other crypto enthusiasts
Be a part of the Interactive Crypto Community
OR
Please fill out the required fields Please fill out the required fields Please fill out the required fields

As of May 2, 2026, the global energy market is buzzing with anticipation. Crude oil prices have taken a sharp dive—down 5% in just a matter of days—driven by renewed optimism surrounding potential US-Iran negotiations. This isn't just a blip on the radar; it’s a development that could redefine supply dynamics, impact investor portfolios, and alter the geopolitical landscape. With Brent crude currently trading at $92.30 per barrel and WTI at $87.50, the numbers paint a picture of a market on edge, waiting to see if a deal could unlock over 1 million barrels per day of Iranian oil. For anyone with a stake in energy—or even just a passing interest in global economics—this moment matters. What could this mean for the future of oil prices, your investments, and the broader economy? Stick with us as we unpack this unfolding story, and if you’re looking for deeper insights, check the AI analysis to see what data-driven models predict.
The oil market has always been a theater of high drama, where geopolitics and economics collide. Right now, the stage is set for a potential game-changer. Over the past week, Brent crude has slid from $97.20 to $92.30 per barrel, while WTI crude has dropped nearly 5% to $87.50. According to data from Bloomberg, this decline is directly tied to whispers of progress in US-Iran diplomatic talks, which could pave the way for a significant boost in Iranian oil exports.
This isn’t mere speculation. On April 25, 2026, Iranian officials signaled they might resume exports if certain sanctions are lifted—a move that could flood the market with additional supply. Just days later, on May 1, the US Secretary of State confirmed that negotiations were “making headway,” fueling market reactions. The numbers are staggering: analysts estimate that a deal could add over 1 million barrels per day to global supply, a figure that has traders recalibrating their positions almost overnight.
But it’s not all rosy. While some see this as a chance to buy low, others warn of volatility if talks collapse. The market is a pressure cooker, and every headline could send prices swinging. For a closer look at where prices might head, see AI price prediction models that crunch the latest data.
If you’re an investor, whether in oil futures, energy stocks, or even broader market indices, this development is a wake-up call. A 5% drop in crude prices might seem like a minor dip, but it signals much larger ripples. Lower oil prices could ease inflationary pressures, potentially benefiting consumer-driven sectors. However, for energy companies, especially those with high production costs, this could squeeze margins.
Consider the immediate playbook: some hedge funds are already positioning for a further drop, betting on an oversupply if Iranian oil hits the market. Others, though, are holding steady, wary of a geopolitical misstep that could reverse the trend. According to a recent report by Reuters, institutional investors are split, with 40% viewing this as a buying opportunity and the rest bracing for uncertainty.
What should you do? Diversification is key—don’t put all your eggs in one barrel, so to speak. Keep an eye on energy ETFs for broader exposure, and monitor news out of Washington and Tehran. For a data-driven edge, get AI-powered insights to see how algorithms are interpreting these market shifts.
To fully grasp the stakes, let’s rewind to 2015. The Iran nuclear deal, formally known as the Joint Comprehensive Plan of Action (JCPOA), temporarily lifted sanctions, allowing Iranian oil to flow back into global markets. At the time, prices dipped as supply surged by nearly 800,000 barrels per day within months, per data from the International Energy Agency (IEA). The parallel to today’s situation is uncanny—hope for a diplomatic breakthrough is once again driving market sentiment.
But history doesn’t repeat itself exactly. The Middle East remains a tinderbox, with tensions between Iran and Saudi Arabia, as well as US domestic political pressures, complicating the picture. If a deal is struck, OPEC+ will face a dilemma: absorb the extra supply by cutting quotas or risk a price war. According to a Financial Times analysis, Saudi Arabia, a key OPEC player, is already signaling reluctance to cede market share.
Beyond geopolitics, raw economics are at play. Global oil demand has been uneven, with China’s economic slowdown offsetting robust growth in India. The IEA projects global demand to hit 103 million barrels per day by late 2026, but an influx of Iranian oil could tip the balance toward oversupply. This isn’t just about numbers—it’s about the delicate dance of production costs, storage capacity, and consumer behavior. For a deeper breakdown of these metrics, check AI fair value estimate for oil-related assets.
NASDAQ:COIN Stock Chart - TradingView
The industry is abuzz with opinions on what’s next. Tom Kloza, global head of energy analysis at OPIS, told CNBC recently, “This is a high-stakes poker game. If Iran re-enters the market, we could see prices stabilize below $90 for Brent, but only if OPEC+ plays ball.” His view reflects a cautious optimism shared by many.
On the flip side, some warn of unintended consequences. Helima Croft, head of commodity strategy at RBC Capital Markets, noted in a Bloomberg interview that a deal could embolden other sanctioned nations to push for similar concessions, potentially destabilizing global trade norms. For energy firms, especially in the US shale sector, lower prices could mean tighter budgets and delayed projects.
The ripple effects extend beyond oil. Renewable energy advocates see this as a chance to push for faster transitions, arguing that price volatility underscores the need for alternatives. It’s a complex web, and every stakeholder—from drillers to policymakers—has a different angle.
Let’s break this down financially. In the short term, lower oil prices could be a boon for airlines and shipping companies, which spend heavily on fuel. Stocks like Delta Air Lines or Maersk could see a bump if this trend holds. Conversely, energy giants like ExxonMobil and Chevron might face headwinds as revenue per barrel shrinks.
Over the long haul, a sustained increase in Iranian supply could reshape investment strategies. Emerging markets reliant on oil imports, like India, could benefit from cheaper energy, boosting their economic growth. On the other hand, oil-dependent economies in the Gulf might need to accelerate diversification plans.
Risk is the name of the game here. Currency fluctuations tied to oil prices—think the petrodollar—could impact global trade. Investors should consider hedging strategies, perhaps through options or futures, to mitigate exposure. For a detailed risk assessment, view AI signals for oil markets and see how predictive models are weighing these factors.
For those who live by the charts, the technical picture offers mixed signals. Brent crude’s Relative Strength Index (RSI) sits at 48, a neutral zone that suggests neither overbought nor oversold conditions. However, the Moving Average Convergence Divergence (MACD) for WTI shows a bearish crossover, hinting at potential downward momentum in the near term.
Here’s a snapshot of the latest metrics:
| Metric | Current Value | Change (Weekly) |
|---|---|---|
| Brent Crude Price | $92.30/barrel | -5.0% |
| WTI Crude Price | $87.50/barrel | -4.8% |
| RSI (Brent) | 48 | Neutral |
Support levels for Brent are near $90, a psychological barrier that could hold if selling pressure eases. Resistance, meanwhile, looms at $95, a threshold tied to recent highs. These indicators aren’t crystal balls, but they offer a roadmap for where sentiment might shift next.
What does the horizon hold? Analysts at Goldman Sachs project that a successful US-Iran deal could cap Brent crude at $85-$90 through 2026, assuming no major disruptions. Without a deal, however, prices could spike back to $100 or beyond, especially if tensions escalate in the Middle East.
The IEA offers a more balanced view, suggesting that global supply buffers—think strategic reserves—could mitigate any oversupply from Iran. Their latest report forecasts a “soft landing” for prices around $88 by year-end, barring unexpected shocks.
Two scenarios dominate the conversation: a diplomatic breakthrough that stabilizes the market, or a breakdown that reignites volatility. My take? Lean toward cautious optimism. History suggests that deals, while messy, often get done when the economic stakes are this high. For a forward-looking perspective, see what the AI predicts for oil price trajectories.
Crude oil prices have fallen 5% recently due to optimism about US-Iran negotiations. A potential deal could lift sanctions on Iranian oil, adding significant supply to the global market and pushing prices down. Brent crude is at $92.30 per barrel, and WTI is at $87.50 as of early May 2026.
If a deal is reached, Iranian oil exports could increase by over 1 million barrels per day, per analyst estimates. This would likely keep prices suppressed in the short term, though OPEC+ might adjust production to stabilize the market. Long-term, it could ease supply constraints and benefit oil-importing nations.
A breakdown in talks could spike prices as markets factor in continued sanctions and supply tightness. Geopolitical tensions in the Middle East could also escalate, adding a risk premium to oil. Volatility would likely dominate until clarity emerges.
Diversify your portfolio to hedge against volatility—consider energy ETFs alongside other sectors. Stay updated on diplomatic developments, as they’ll drive near-term price action. For data-driven guidance, get professional AI analysis to navigate these choppy waters.
Yes, lower oil prices could slow investment in renewables by reducing urgency for alternatives. However, sustained volatility might accelerate the push for green energy as governments seek stability. It’s a double-edged sword with no clear winner yet.
The 5% drop in crude oil prices amid US-Iran negotiation hopes is more than a headline—it’s a signal of potential tectonic shifts in the energy landscape. Whether you’re an investor, a policymaker, or just someone keeping tabs on global economics, the stakes are high. A deal could stabilize prices and ease supply pressures, but a misstep could send markets into a tailspin.
The path forward demands vigilance. Track geopolitical updates, diversify your exposure, and lean on data to guide decisions. As this story evolves, staying ahead of the curve will be crucial. For one last deep dive into the numbers, check the AI analysis and see how predictive models are interpreting these historic developments. What do you think—will diplomacy win the day, or are we in for more turbulence? Drop your thoughts below.


ALL
TRENDING
WATCHLIST
Total Market Cap The Total Market Capitalization (Market Cap) is an indicator that measures the size of all the cryptocurrencies.It’s the total market value of all the cryptocurrencies' circulating supply: so it’s the total value of all the coins that have been mined.
{[{ marketcap }]} {[{ marketcapchange.toLocaleString(undefined, {maximumFractionDigits:2}) }]}% (24H) {[{ marketcapchange.toLocaleString(undefined, {maximumFractionDigits:2}) }]}% (24H)
Symbol
Price Cryptocurrency prices are volatile, and the prices change all the time. We are collecting all the data from several exchanges to provide the most accurate price available.
24H Cryptocurrency prices are volatile… The 24h % change is the difference between the current price and the price24 hours ago.
Trade
{[{ item.name }]}
{[{ index + $index}]}
{[{ item.pair.split('_')[0] }]}
Ƀ{[{item.price.toLocaleString(undefined, {maximumFractionDigits: 5}) }]} ${[{item.price.toLocaleString(undefined, {maximumFractionDigits: 5}) }]}
{[{ item.change24.toLocaleString(undefined, {maximumFractionDigits: 2}) }]}%
{[{ item.change24.toLocaleString(undefined, {maximumFractionDigits: 2}) }]}%
Symbol
Price Cryptocurrency prices are volatile, and the prices change all the time. We are collecting allthe data fromseveral exchanges to provide the most accurate price available.
24H Cryptocurrency prices are volatile… The 24h % change is the difference between the current priceand the price24 hours ago.
Trade
{[{ item.name }]}
{[{ index + $index}]}
{[{ item.pair.split('_')[0] }]}
Ƀ{[{item.price.toLocaleString(undefined, {maximumFractionDigits: 5}) }]} ${[{item.price.toLocaleString(undefined, {maximumFractionDigits: 5}) }]}
{[{ item.change24.toLocaleString(undefined, {maximumFractionDigits: 2}) }]}%
{[{ item.change24.toLocaleString(undefined, {maximumFractionDigits: 2}) }]}%


BTC Technical Analysis
May 27, 2026 | Joanna Newman

Soybeans Technical Analysis
May 27, 2026 | Joanna Newman
Live Cattle Technical Analysis
May 27, 2026 | Joanna Newman

DJI Technical Analysis
May 27, 2026 | Joanna Newman
Tezos (XTZ) Review 2024: Everything You Need to Know Before Buying Tezos
.article-container { font-family: Arial, sans-serif; line-height: 1.6; color: #333; backgrou...
Chromia (CHR) Review 2024: Everything You Need to Know Before Buying Chromia
Illuvium (ILV) Review 2024: Everything You Need to Know Before Buying Illuvium
My Neighbor Alice (ALICE) Review 2024: Everything You Need to Know Before Buying My Neighbor Alice
Star Atlas (ATLAS) Review 2024: Everything You Need to Know Before Buying Star Atlas
TabTrade
What Is TabTrade? A Complete IntroductionTabTrade is a globally oriented multi-asset CFD and forex b...
Funded7
In the fast-moving world of proprietary trading, 2026 has marked a significant shift in what traders...
Bullwaves
Bullwaves Review 2026: A Premium MT5 Brokerage for Multi-Asset TradersBullwaves has quickly carved o...
BlackBull Markets
...
OQtima
Oqtima is an emerging online trading platform that offers a wide range of financial instruments, inc...
(adsbygoogle = window.adsbygoogle || []).push({}); Introduction In t...
(adsbygoogle = window.adsbygoogle || []).push({}); Einführung Wenn es um Er...
Mobi
Are you someone who makes international payments regularly using Bitcoin? Or do you travel a lot and...
Bitcoin.com
Bitcoin.com is a free downloadable Bitcoin wallet that allows users to trade and receive Bitcoins. T...
BTC.com
Created by Bitmain in 2016, BTC.com is a leading open-source Bitcoin and Bitcoin Cash storage platfo...
Crude Oil Prices Drop 5% on US-Iran Talks Hopes: Why This Could Reshape the Energy Market
/* Modern SEO & AI-Optimized Article Styles */ /* Fonts loaded via link tags in head for b
CoinsBank
What functions do CoinsBank Bitcoin have? The functions of the application are varied and protected
Ethereum flips Coca-Cola and Alibaba as ETH gains 42% in 5 days
.article-container { font-family: Arial, sans-serif; line-height: 1.6; color: #
Elon Musk adds 'Bitcoin' to Twitter bio with 43.7M Followers
The founder and Tesla boss had been declared the world's richest man severally after the rebound
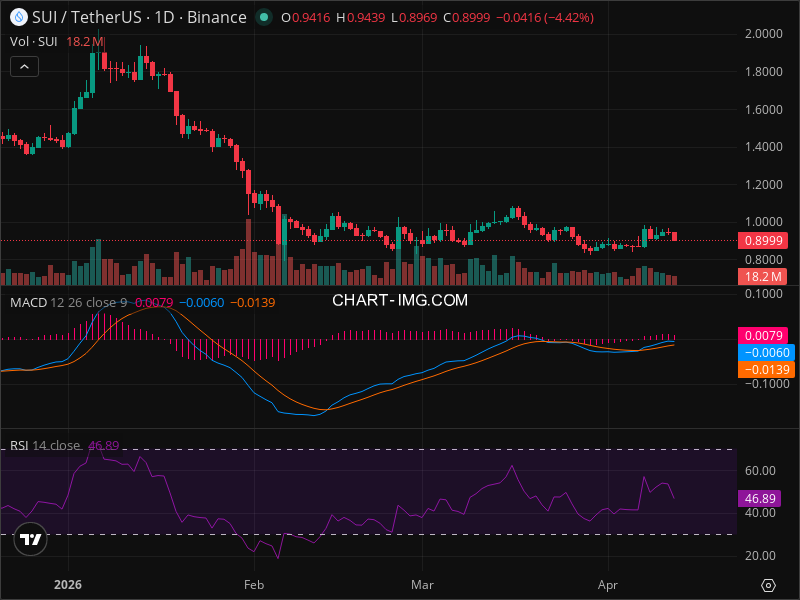
Is SUI on the Brink of Collapse? The Chart Signals You Need to Know
SUI Chart | TradingView Is SUI on the Brink of Collapse? The Chart Signals You Ne
The Top 10 Crypto Assets with the Highest Potential in 2025
.article-container { font-family: Arial, sans-serif; line-height: 1.6; color: #333; background-color
The Ultimate Bitcoin Review 2024: Everything You Need to Know Today
.article-container { font-family: Arial, sans-serif; line-height: 1.6; color: #333; background-colo
The Everyday Fruit that's a Powerhouse of Nutrition and Your Weight Loss Ally
(adsbygoogle = window.adsbygoogle || []).push({}); IntroductionWhen it comes to nutrition a
The oldest and most powerful remedy to permanently get rid of insects and ants
(adsbygoogle = window.adsbygoogle || []).push({}); IntroductionEach year, as the hot season
Two Beds, One Dream: The Growing Trend of Sleeping Apart for Better Rest
(adsbygoogle = window.adsbygoogle || []).push({}); IntroductionIn an era where quality slee
(adsbygoogle = window.adsbygoogle || []).push({}); Introduction In t...
(adsbygoogle = window.adsbygoogle || []).push({}); Einführung Wenn es um Er...
Mobi
Are you someone who makes international payments regularly using Bitcoin? Or do you travel a lot and...
Bitcoin.com
Bitcoin.com is a free downloadable Bitcoin wallet that allows users to trade and receive Bitcoins. T...
BTC.com
Created by Bitmain in 2016, BTC.com is a leading open-source Bitcoin and Bitcoin Cash storage platfo...

 Français
 Spanish
 Deutsch
 Português
 Türkçe
 Italiano
 العربية
 Русский
 Chinese
 Korean
 Japanese
 Vietnamese
 Hebrew
 Hindi
Hindi
 Greek
Greek
 Polish
 Thai
Thai
 Dutch
Dutch
 Malay
Malay


.png)
.png)
.png)


COMMENTS (0)