
 Français
 Spanish
 Deutsch
 Português
 Türkçe
 Italiano
 العربية
 Русский
 Chinese
 Korean
 Japanese
 Vietnamese
 Hebrew
 Hindi
Hindi
 Greek
Greek
 Polish
 Thai
Thai
 Dutch
Dutch
 Malay
Malay
FIL Survival Test: Assessing the Descent or Revival with Market Insight
Filecoin (FIL) is teetering on a precarious edge as it navigates a challenging market landscape. Sitting at a crucial price level, FIL's struggle in a risk-on environment raises alarms for crypto investors. With the S&P 500 and NASDAQ-100 both basking in glory, one might expect FIL to ride the wave of optimism. Yet, the reality tells a different story, one of resistance and potential breakdown. This is not just another crypto analysis; it's an urgent call for strategic foresight.
In this moment of volatility, smart investors are turning to tools like InteractiveCrypto Pro to dissect the layers of complexity within FIL’s technical landscape. With powerful AI signals and alerts, these tools arm you with the insights needed to navigate turbulent waters. But as we dive deeper, the question lingers: Will FIL break free or succumb to the pressure?
Market Context
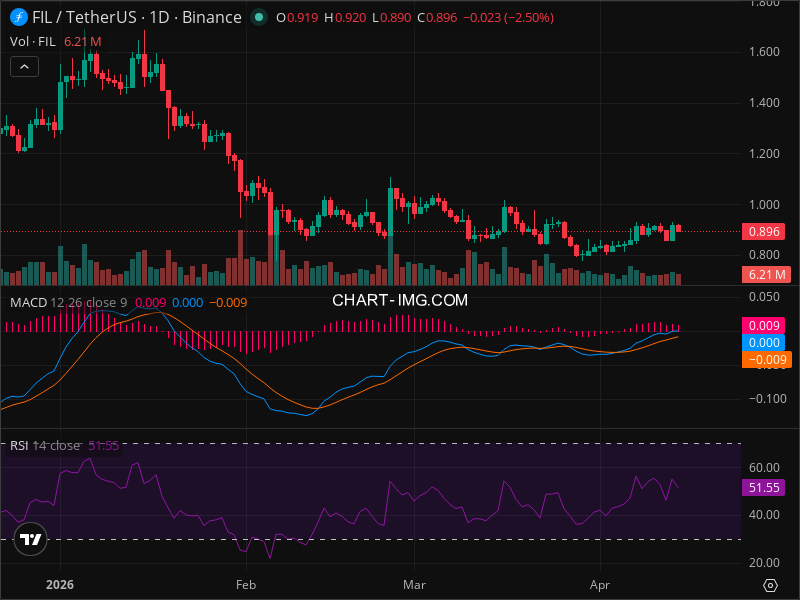
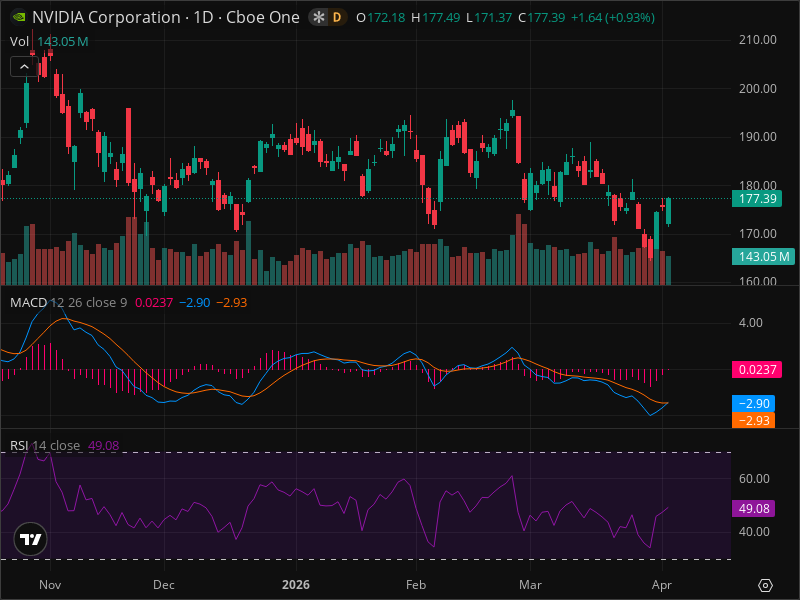
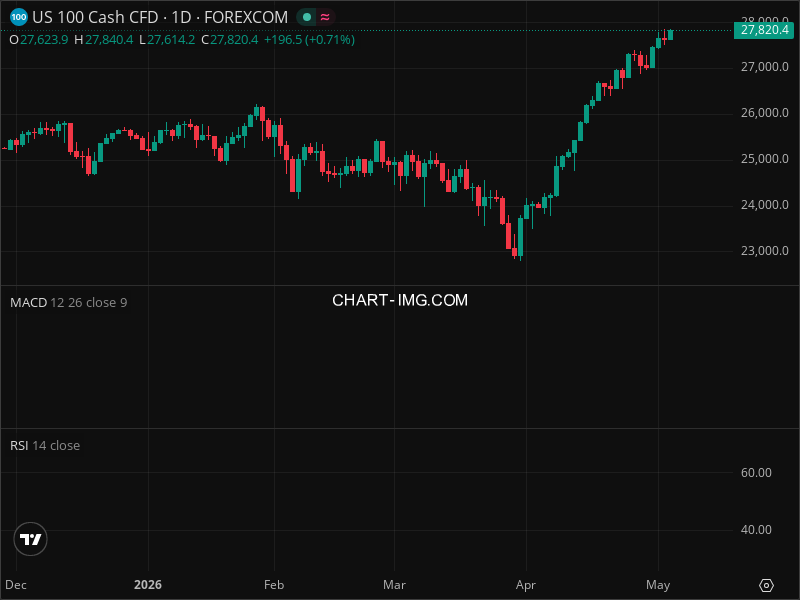
First, let's set the stage with the broader market context. The current financial landscape is painted by a clear risk-on sentiment. Both the SPY and QQQ are charting impressive upward trajectories. This typically fosters a supportive backdrop for cryptocurrencies, bolstered by a weakening US Dollar and falling bond yields. However, FIL isn't dancing to the same tune. Despite the favorable macro conditions, FIL's struggle at $0.896 signals more than just a temporary lull. It's a stark divergence, begging the question—what's holding FIL back?
Technical Analysis
The answer may lie in FIL's technical setup. The price action reveals a sideways to slightly bearish trend, a stark contrast to the broader market's bullishness. After experiencing a steep decline in the early months of 2026, FIL has settled into a narrow range, unable to gain traction. Today's bearish candle only compounds the pressure, as FIL contends with significant resistance at $0.92—a level defined by both Fibonacci retracement and recent highs.
Zooming in on the technical indicators, we find a landscape fraught with mixed signals. The RSI hovers at a neutral 51.55, showing neither bullish nor bearish momentum. Meanwhile, the MACD, though slightly bullish, is waning in strength, a subtle warning against betting on upward movement. The price is also trapped below its 50-day and 200-day moving averages, further entrenching the bearish narrative. For those seeking clarity in chaos, the AI analysis platform, InteractiveCrypto Pro, provides the nuanced interpretations necessary to make informed decisions.
The presence of a descending triangle pattern amplifies the urgency of the situation. With a flat base around $0.80, any confirmed breakdown below this level could spell significant trouble. The pattern suggests a bearish outlook, albeit with moderate reliability. The critical support at $0.80 is being tested, and a breach could set the stage for a decline towards the $0.72 mark, a key Fibonacci level and support. In contrast, a break above the $0.92 resistance could signal a shift in momentum, potentially targeting $1.00 or even $1.10.
FIL Scenarios
Navigating these possibilities, we can delineate three scenarios for FIL: bullish, bearish, and neutral. The bearish scenario holds a 50% probability, with breakdown conditions necessitating increased volume and a bearish MACD crossover. Conversely, a bullish escape, with a 30% probability, requires a breakout above $0.92, bolstered by volume and MACD support. The neutral path remains a possibility, with FIL likely oscillating between $0.80 and $0.92 for the short term.
Trading Strategy
For traders, the recommendation is clear: exercise caution. The advised strategy is a sell, with an entry zone between $0.92 and $0.89. The associated stop loss sits at $0.98, capping risk at 6.7%, while take profit targets are set at $0.80 and $0.72, offering rewards of 10% and 18.9% respectively. This presents a risk/reward ratio of 1:1.49, underlining the prudence of a measured approach.
However, no strategy is without risk. Unexpected positive developments for Filecoin or the cryptocurrency market at large could upset the current bearish setup. Similarly, a broader market rally could lift FIL in spite of its technical woes. Traders are advised to maintain a small to moderate position, reflective of the uncertainties inherent in the current analysis.
In conclusion, the FIL narrative is one of potential and peril. With descending patterns and critical levels being tested, the market's next move will define FIL's trajectory. For those ready to seize the opportunity, remaining informed and agile is paramount.
Key Takeaways:
- FIL is struggling at $0.896, despite a risk-on market environment.
- Key resistance at $0.92 and support at $0.80 are pivotal levels.
- Bearish pattern confirmed by a descending triangle formation.
- Technical indicators lean towards a bearish outlook with neutral RSI and weakening MACD.
- Three scenarios outlined: bearish (50% probability), bullish (30%), and neutral (20%).
- Recommended trading strategy: sell within $0.92 - $0.89 with stop loss at $0.98.
- Position sizing should be cautious due to potential market volatility.
- The probability of continued downward pressure remains significant.
FINAL VERDICT
| Decision | Value |
|---|---|
| ACTION | SELL |
| Confidence Level | 70% |
| Entry Price | $0.92 |
| Stop Loss | $0.98 |
| Take Profit | $0.72 |
| Risk/Reward | 1:1.49 |
| Success Probability | 50% |
| Timeframe | 2-4 weeks |
WHY THIS TRADE: The technical signals including the descending triangle and resistance at $0.92 strongly suggest further downside, making a sell strategy with defined risk levels prudent.
WHAT MUST HAPPEN: Watch for a daily close above $0.98; this would invalidate the current bearish view and signal potential upward momentum.
FAQ
SOURCES & REFERENCES
InteractiveCrypto Pro: Analyzing FIL's Potential - Read more
CryptoMarket Analysis: FIL's Technical Landscape - Read more
GET AN EDGE WITH AI ANALYSIS
Tired of missing big moves? InteractiveCrypto Pro uses artificial intelligence to analyze stocks and crypto 24/7.
What you get:
- AI-Powered Signals with 94% historical accuracy
- Real-time Fair Value estimates
- 40+ technical indicators analyzed automatically
- Instant alerts when key levels are hit
LIMITED TIME: 50% OFF - Plans from just $6.49/month
Start Your Free Analysis Now →
Ready to Trade FIL Like a Pro?
InteractiveCrypto Pro gives you the edge with:
- AI-Powered Signals - 94% accuracy
- Real-time Fair Value Estimates
- 40+ Technical Indicators
- Instant alerts on key levels
50% OFF - Just $6.49/month
Start Free Analysis →Compare Your Options:
Compare trading platforms to find the best tools for your strategy.


.png)
.png)
.png)


COMMENTS (0)