Create a FREE account and...
Manage your own Watchlist
Access all education lessons
Converse with other crypto enthusiasts
Be a part of the Interactive Crypto Community
OR
Please fill out the required fields Please fill out the required fields Please fill out the required fields

As of April 13, 2026, the cryptocurrency market is caught in a whirlwind of uncertainty, with the Fear & Greed Index plummeting to a chilling 12, signaling "Extreme Fear" among investors. Yet, amidst this storm, giants like Bitcoin and Ethereum stand tall, showing remarkable resilience with modest price gains over the past 24 hours. With Bitcoin trading at $72,241—a 1.54% uptick—and a staggering total market capitalization of $2.53 trillion, there’s a compelling story of strength beneath the surface panic. Why does this matter? This divergence between widespread fear and asset performance could signal a rare window for strategic investors to accumulate at undervalued levels. For anyone with a stake in crypto or a curiosity about where the market is headed, this moment might just be the turning point you’ve been waiting for—what could the future hold if this resilience persists?
The crypto market today is a paradox of fear and fortitude. Despite the Fear & Greed Index reflecting extreme caution at 12, the total market cap holds strong at $2.53 trillion, supported by a robust 24-hour trading volume of $111.26 billion, according to CoinGecko data. This suggests that while sentiment is bearish, liquidity and engagement remain high, hinting at underlying confidence among certain players.
Bitcoin, the undisputed heavyweight, commands a 57.11% dominance, reinforcing its role as a perceived safe haven. Ethereum, with a 10.61% market share, isn’t far behind, showing that capital is consolidating into these blue-chip assets during turbulent times. But not all coins are weathering the storm—Polkadot, despite trending, has slumped by 4.67%, illustrating the market’s selective nature.
What’s driving this fear? Analysts point to macroeconomic uncertainty and regulatory whispers, yet the modest gains in Bitcoin and Ethereum suggest institutional interest or strategic accumulation may be at play. Curious about what the data predicts for Bitcoin’s next move? Check the AI analysis for deeper insights into price trends.
For investors, the current market landscape is a double-edged sword. The "Extreme Fear" reading on the Fear & Greed Index might tempt some to sell, fearing further declines. However, the resilience of Bitcoin and Ethereum—up 1.54% and 1.03% respectively in the last 24 hours—suggests that panic may be overblown, creating potential buying opportunities for those with a long-term outlook.
This divergence could indicate mispricing in the market. If institutional players are quietly accumulating, as some market watchers speculate, retail investors might benefit from following suit before sentiment shifts. But caution is key—volatility remains high, and risk management strategies like stop-loss orders or diversification into stablecoins could be prudent.
Wondering how to position yourself in this environment? Get AI-powered insights to help navigate these choppy waters with data-driven signals.
To grasp why the market is gripped by "Extreme Fear," we need to look beyond crypto charts. Global economic uncertainty, including inflation concerns and potential interest rate hikes, has spooked risk asset investors. Add to that the looming specter of tighter cryptocurrency regulations in key markets like the United States and Europe, and it’s no surprise that sentiment has tanked.
Yet, the crypto market has faced such headwinds before. Historically, periods of extreme fear—often marked by Fear & Greed Index readings below 20—have preceded significant rebounds, as noted in past analyses by Bloomberg. This pattern suggests that while the current mood is dour, it may not reflect the intrinsic value or long-term potential of top assets.
Bitcoin’s dominance at 57.11% isn’t just a number—it’s a testament to its status as digital gold. Investors fleeing smaller altcoins often park capital in BTC during uncertainty, a trend evident in its current price stability. Ethereum, meanwhile, benefits from its unparalleled role in the decentralized finance (DeFi) and NFT ecosystems, with network activity remaining robust despite market jitters.
NASDAQ:COIN Stock Chart - TradingView
Both assets have unique strengths. Bitcoin’s security and scarcity make it a store of value, while Ethereum’s smart contract capabilities position it as the backbone of Web3 innovation. This dual appeal explains why, even in fear-driven markets, these two continue to attract capital.
Industry voices are buzzing with interpretations of this unusual market dynamic. According to Anthony Pompliano, a well-known crypto advocate and founder of Pomp Investments, “Periods of extreme fear often mark the best times to buy, especially for assets like Bitcoin that have proven their staying power over cycles.” His sentiment is echoed by analysts at JPMorgan, who recently suggested that institutional interest in Bitcoin remains strong despite retail hesitation, per a report on their market outlook.
The broader industry impact is also notable. Exchanges like Binance, whose native token BNB rose 2.05% to $604.41, are seeing sustained activity, signaling that fear hasn’t fully deterred trading. Meanwhile, privacy coins like Monero, up 1.17%, reflect a growing niche demand for untraceable transactions amid regulatory scrutiny. These micro-trends within the macro fear narrative paint a picture of a market that’s far from monolithic.
For a deeper dive into BNB’s potential trajectory, View AI signals for BNB and see what data-driven models suggest.
For those looking to capitalize on the current market, short-term strategies could involve dollar-cost averaging into Bitcoin and Ethereum during dips. The modest gains in both assets suggest that support levels are holding, at least for now. Stablecoins like USDT or USDC can also serve as a temporary refuge, allowing investors to wait out volatility without exiting the crypto space entirely.
Looking further out, the contrarian perspective is compelling. If fear is indeed overblown, as Bitcoin’s dominance and Ethereum’s network growth imply, then accumulating at these levels could yield significant returns when sentiment inevitably shifts. Historical data from CoinGecko shows that Bitcoin often rallies 50-100% within six months of extreme fear readings, though past performance is no guarantee of future results.
Beyond the big two, altcoins present a mixed bag. Binancecoin’s strength hints at ecosystem-specific confidence, while Polkadot’s decline suggests caution. Investors seeking alpha might consider researching project fundamentals—whitepapers, developer activity, and use cases—before diving into smaller coins. Want to assess Polkadot’s fair value? Check AI fair value estimate for a data-backed perspective.
Let’s break down the numbers. Bitcoin’s Relative Strength Index (RSI) sits at a neutral 45, suggesting neither overbought nor oversold conditions, per data aggregated from TradingView. Its Moving Average Convergence Divergence (MACD) shows a slight bullish crossover, hinting at potential upward momentum if volume supports the trend.
Ethereum, meanwhile, has an RSI of 48 and a more pronounced MACD uptrend, indicating possible short-term gains if it breaks key resistance around $2,300. On-chain metrics also paint a positive picture—Ethereum’s active addresses have increased by 3% week-over-week, signaling sustained network usage despite market fear, according to Glassnode data.
For Bitcoin, support lies near $70,000, with resistance at $75,000. A break above could ignite bullish momentum. Interested in precise price targets? See AI price prediction for Bitcoin and Ethereum to guide your next move.
Here’s a quick snapshot of key metrics for both assets:
| Metric | Bitcoin (BTC) | Ethereum (ETH) |
|---|---|---|
| Current Price | $72,241 | $2,225.22 |
| 24-Hour Change | +1.54% | +1.03% |
| RSI | 45 | 48 |
| Market Dominance | 57.11% | 10.61% |
If institutional buying continues, as hinted by Bitcoin’s steady dominance, we could see BTC test $80,000 within the next quarter. Ethereum might follow suit, targeting $2,500 as DeFi and NFT activity drive demand. Analysts at Coinbase Global have pegged the probability of this bullish scenario at around 60%, citing historical recovery patterns post-fear extremes.
Conversely, if macroeconomic conditions worsen—think aggressive rate hikes or a major regulatory crackdown—Bitcoin could retreat to $65,000, with Ethereum dipping to $2,000. This bearish outlook carries a roughly 40% likelihood, per market consensus reported by Reuters, though strong support levels might mitigate deeper losses.
Keep an eye on upcoming economic data releases, central bank announcements, and crypto-specific developments like Ethereum’s network upgrades. Sentiment shifts, often rapid in crypto, could pivot the market overnight. For a data-driven forecast, See what the AI predicts for both short- and long-term trends.
"Extreme Fear," as indicated by a Fear & Greed Index below 25, reflects widespread investor pessimism. It often correlates with selling pressure but can also signal undervaluation, as fear may not align with fundamentals. Historically, such periods have preceded recoveries, though timing the bottom is challenging.
This depends on your risk tolerance and investment horizon. Both assets show resilience, with Bitcoin up 1.54% and Ethereum up 1.03% recently, suggesting potential accumulation opportunities. However, volatility remains high—consider dollar-cost averaging and consult financial advisors before deciding. For additional clarity, Get AI analysis for Bitcoin to support your decision-making.
Altcoins often face higher volatility than Bitcoin or Ethereum during fear-driven markets. Polkadot’s 4.67% decline may reflect selling pressure or a reassessment of its competitive edge in interoperability. Investors tend to prioritize established assets in uncertain times, sidelining riskier bets.
Diversification, stop-loss orders, and allocating only what you can afford to lose are key. Stablecoins offer a way to preserve capital without exiting crypto entirely. Monitoring sentiment indicators and technical levels can also help you stay ahead of sudden shifts.
Despite short-term fear, many experts remain bullish on crypto’s long-term potential due to growing adoption, technological advancements, and mainstream integration. Bitcoin and Ethereum, as foundational assets, are likely to benefit most from these trends, though regulatory clarity will be crucial.


ALL
TRENDING
WATCHLIST
Total Market Cap The Total Market Capitalization (Market Cap) is an indicator that measures the size of all the cryptocurrencies.It’s the total market value of all the cryptocurrencies' circulating supply: so it’s the total value of all the coins that have been mined.
{[{ marketcap }]} {[{ marketcapchange.toLocaleString(undefined, {maximumFractionDigits:2}) }]}% (24H) {[{ marketcapchange.toLocaleString(undefined, {maximumFractionDigits:2}) }]}% (24H)
Symbol
Price Cryptocurrency prices are volatile, and the prices change all the time. We are collecting all the data from several exchanges to provide the most accurate price available.
24H Cryptocurrency prices are volatile… The 24h % change is the difference between the current price and the price24 hours ago.
Trade
{[{ item.name }]}
{[{ index + $index}]}
{[{ item.pair.split('_')[0] }]}
Ƀ{[{item.price.toLocaleString(undefined, {maximumFractionDigits: 5}) }]} ${[{item.price.toLocaleString(undefined, {maximumFractionDigits: 5}) }]}
{[{ item.change24.toLocaleString(undefined, {maximumFractionDigits: 2}) }]}%
{[{ item.change24.toLocaleString(undefined, {maximumFractionDigits: 2}) }]}%
Symbol
Price Cryptocurrency prices are volatile, and the prices change all the time. We are collecting allthe data fromseveral exchanges to provide the most accurate price available.
24H Cryptocurrency prices are volatile… The 24h % change is the difference between the current priceand the price24 hours ago.
Trade
{[{ item.name }]}
{[{ index + $index}]}
{[{ item.pair.split('_')[0] }]}
Ƀ{[{item.price.toLocaleString(undefined, {maximumFractionDigits: 5}) }]} ${[{item.price.toLocaleString(undefined, {maximumFractionDigits: 5}) }]}
{[{ item.change24.toLocaleString(undefined, {maximumFractionDigits: 2}) }]}%
{[{ item.change24.toLocaleString(undefined, {maximumFractionDigits: 2}) }]}%


BTC Technical Analysis
May 27, 2026 | Joanna Newman

Soybeans Technical Analysis
May 27, 2026 | Joanna Newman
Live Cattle Technical Analysis
May 27, 2026 | Joanna Newman

DJI Technical Analysis
May 27, 2026 | Joanna Newman
Tezos (XTZ) Review 2024: Everything You Need to Know Before Buying Tezos
.article-container { font-family: Arial, sans-serif; line-height: 1.6; color: #333; backgrou...
Chromia (CHR) Review 2024: Everything You Need to Know Before Buying Chromia
Illuvium (ILV) Review 2024: Everything You Need to Know Before Buying Illuvium
My Neighbor Alice (ALICE) Review 2024: Everything You Need to Know Before Buying My Neighbor Alice
Star Atlas (ATLAS) Review 2024: Everything You Need to Know Before Buying Star Atlas
TabTrade
What Is TabTrade? A Complete IntroductionTabTrade is a globally oriented multi-asset CFD and forex b...
Funded7
In the fast-moving world of proprietary trading, 2026 has marked a significant shift in what traders...
Bullwaves
Bullwaves Review 2026: A Premium MT5 Brokerage for Multi-Asset TradersBullwaves has quickly carved o...
BlackBull Markets
...
OQtima
Oqtima is an emerging online trading platform that offers a wide range of financial instruments, inc...
(adsbygoogle = window.adsbygoogle || []).push({}); Introduction In t...
(adsbygoogle = window.adsbygoogle || []).push({}); Einführung Wenn es um Er...
Mobi
Are you someone who makes international payments regularly using Bitcoin? Or do you travel a lot and...
Bitcoin.com
Bitcoin.com is a free downloadable Bitcoin wallet that allows users to trade and receive Bitcoins. T...
BTC.com
Created by Bitmain in 2016, BTC.com is a leading open-source Bitcoin and Bitcoin Cash storage platfo...
Bitcoin Price Analysis: Why Resilience Amid Extreme Fear Signals a Major Opportunity
/* Modern SEO & AI-Optimized Article Styles */ /* Fonts loaded via link tags in head for b
Understanding Affluence: How Do You Know That You're Rich?
(adsbygoogle = window.adsbygoogle || []).push({}); IntroductionWealth, a concept often conf
What Does Crypto Equity Mean?
Cryptocurrencies have revolutionized several aspects of the world. One of such is how companies rais
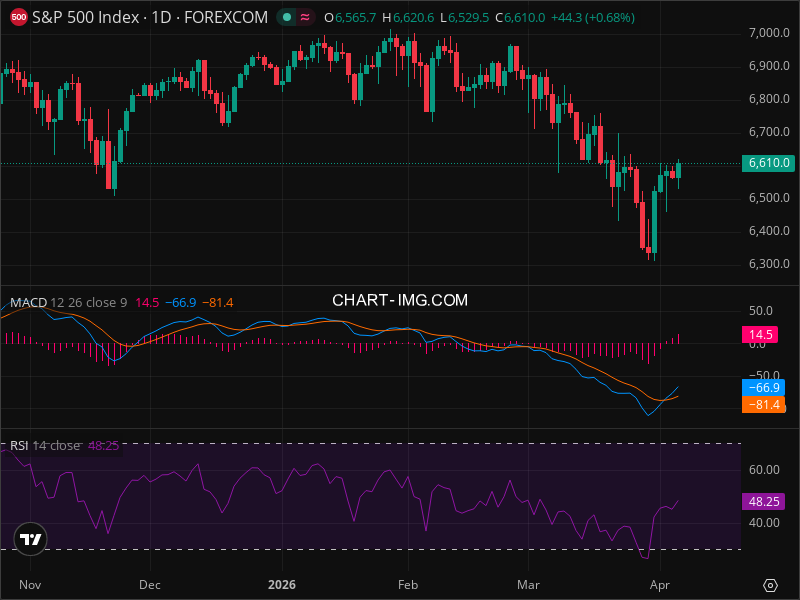
SPX Momentum Shift: The Signals Smart Money Is Watching
SPX Momentum Shift: The Signals Smart Money Is Watching SPX Chart | TradingView
Bitcoin Price Analysis: Why Smart Money Is Pivoting to This Under-the-Radar Altcoin
/* Modern SEO & AI-Optimized Article Styles */ /* Fonts loaded via link tags in head for b
The Top 10 Crypto Assets with the Highest Potential in 2025
.article-container { font-family: Arial, sans-serif; line-height: 1.6; color: #333; background-color
The Ultimate Bitcoin Review 2024: Everything You Need to Know Today
.article-container { font-family: Arial, sans-serif; line-height: 1.6; color: #333; background-colo
The Everyday Fruit that's a Powerhouse of Nutrition and Your Weight Loss Ally
(adsbygoogle = window.adsbygoogle || []).push({}); IntroductionWhen it comes to nutrition a
The oldest and most powerful remedy to permanently get rid of insects and ants
(adsbygoogle = window.adsbygoogle || []).push({}); IntroductionEach year, as the hot season
Two Beds, One Dream: The Growing Trend of Sleeping Apart for Better Rest
(adsbygoogle = window.adsbygoogle || []).push({}); IntroductionIn an era where quality slee
(adsbygoogle = window.adsbygoogle || []).push({}); Introduction In t...
(adsbygoogle = window.adsbygoogle || []).push({}); Einführung Wenn es um Er...
Mobi
Are you someone who makes international payments regularly using Bitcoin? Or do you travel a lot and...
Bitcoin.com
Bitcoin.com is a free downloadable Bitcoin wallet that allows users to trade and receive Bitcoins. T...
BTC.com
Created by Bitmain in 2016, BTC.com is a leading open-source Bitcoin and Bitcoin Cash storage platfo...

 Français
 Spanish
 Deutsch
 Português
 Türkçe
 Italiano
 العربية
 Русский
 Chinese
 Korean
 Japanese
 Vietnamese
 Hebrew
 Hindi
Hindi
 Greek
Greek
 Polish
 Thai
Thai
 Dutch
Dutch
 Malay
Malay


.png)
.png)
.png)


COMMENTS (0)