
 Français
 Spanish
 Deutsch
 Português
 Türkçe
 Italiano
 العربية
 Русский
 Chinese
 Korean
 Japanese
 Vietnamese
 Hebrew
 Hindi
Hindi
 Greek
Greek
 Polish
 Thai
Thai
 Dutch
Dutch
 Malay
Malay
SPX Breakout Imminent? 5 Chart Patterns Aligning Now
The S&P 500 (SPX) is hovering at a critical juncture, poised precariously between the abyss of a bearish downturn and the promising horizon of a bullish breakout. Traders and investors worldwide are on high alert, closely monitoring key technical levels that could determine the next major move in this pivotal market index. In a world where financial landscapes are constantly shifting, understanding the current setup of the SPX has never been more crucial. But here's where it gets interesting: multiple technical signals are converging, each whispering a story of potential volatility and opportunity. The stakes are high, and the time to act or wait patiently is now.
In today's intricate financial ecosystem, the SPX stands as a barometer of market sentiment, reflecting the fortunes of 500 of America's largest publicly traded companies. As the SPX dances around its all-time highs, institutional investors are scrutinizing every tick, looking for clues that might reveal the market's next direction. The index's movements hold the power to sway sentiment, influence investment decisions, and ultimately shape the economic narrative.
As we delve into the current dynamics, it's essential to understand the macro conditions at play. The SPX is currently navigating a complex landscape, characterized by a strengthening US Dollar and rising bond yields. These factors are not merely background noise; they are the headwinds and tailwinds influencing the index's journey. A stronger dollar can dent multinational earnings, while rising yields pose a threat to growth stock valuations. And yet, despite these challenges, the SPX has maintained an uptrend since early April, embodying a market that remains cautiously optimistic even in the face of adversity.
SPX Technical Setup
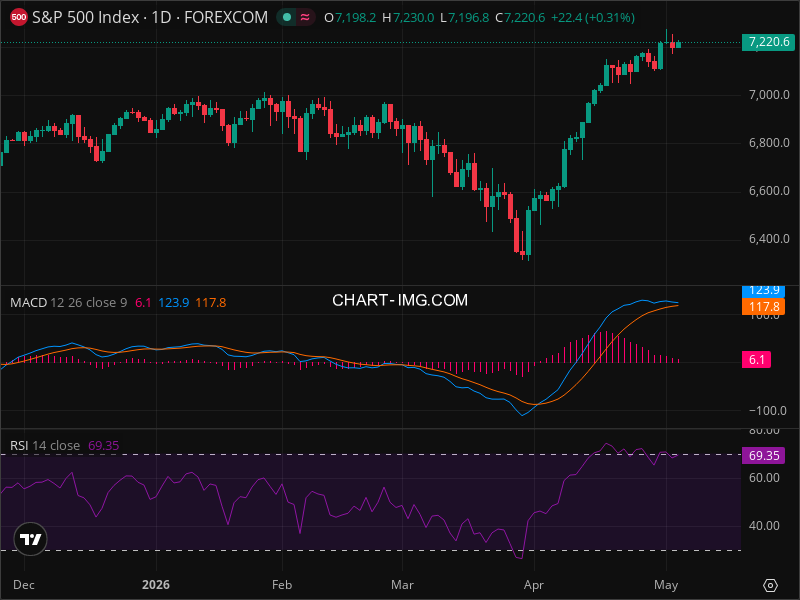
Now, let's zero in on the SPX's current setup. The index recently tested new highs, brushing against the resistance at 7,230 before pulling back slightly. This pullback, marked by a bearish engulfing pattern, raises questions about potential market exhaustion or profit-taking. With support levels at 7,200 and 7,100, traders are eyeing these zones as critical battlefields where bulls and bears will vie for control. A potential ascending wedge pattern adds another layer of complexity, suggesting a possible bearish breakdown if confirmed by a close below 7,100.
A deeper dive into the technical indicators paints a nuanced picture. The RSI hovers near overbought territory at 69.35, hinting at a market ripe for a pullback or consolidation. Meanwhile, the MACD remains positive, though a shortening histogram suggests weakening momentum. The SPX's position above key moving averages reinforces the uptrend, yet the specter of a potential retracement looms large, with Fibonacci levels indicating possible pullback zones around 6,900 and 6,730.
Possible Scenarios
As we explore the three possible scenarios facing the SPX, the probabilities provide a tantalizing glimpse into what might unfold. A bullish breakout above 7,230, accompanied by strong volume, could propel the index toward new heights at 7,300 and 7,400. Yet, the bearish scenario, with a breakdown of the ascending wedge and a close below 7,100, poses a real threat, targeting 7,000 and even 6,800. In between these extremes lies a neutral zone, with the SPX consolidating between 7,100 and 7,230 as the market seeks direction.
Trading Strategy
Trading strategies in this environment require precision and discipline. A hold recommendation currently stands, urging caution amid mixed signals. For those contemplating a short position, a stop loss at 7,080 and targets at 7,000 and 6,800 offer potential rewards if the bearish scenario unfolds. Conversely, a break above 7,230 would present a compelling entry point for the bulls, signaling further upside potential.
Consider using analysis tools to help you make informed decisions.
But the road ahead is fraught with risks. Unexpected macro news, earnings disappointments, or geopolitical events could all serve as catalysts for increased volatility. The SPX's journey is not without its pitfalls, and traders must remain vigilant, ready to adapt to the ebb and flow of the markets.
Many traders find success using an AI-powered platform.
In conclusion, the SPX's current technical setup is a masterpiece of tension and anticipation. The interplay of indicators, patterns, and macro conditions creates a landscape ripe with possibility. For those willing to navigate these turbulent waters, the potential rewards are significant.
Key Takeaways:
- SPX's resistance at 7,230 and support at 7,100 are critical levels.
- Potential ascending wedge hints at a bearish breakdown.
- RSI near 70 suggests possible pullback.
- MACD positive but momentum may be weakening.
- Fibonacci levels indicate potential retracement zones.
- Bullish scenario targets 7,300-7,400; bearish targets 7,000-6,800.
- Hold stance recommended; entry upon confirmation of patterns.
- Macro conditions (USD strength, yields) influence SPX dynamics.
FINAL VERDICT
| Decision | Value |
|---|---|
| ACTION | HOLD |
| Confidence Level | 65% |
| Entry Price | $N/A (await confirmation) |
| Stop Loss | $7,080 (if shorting) |
| Take Profit | $7,000 and $6,800 (if shorting) |
| Risk/Reward | 1:1.44 |
| Success Probability | 35% (bearish scenario) |
| Timeframe | 1-2 weeks |
WHY THIS TRADE: The mixed technical signals and macro headwinds suggest holding positions while awaiting confirmation of a breakout above 7,230 or a breakdown below 7,100.
WHAT MUST HAPPEN: A clear breakout or breakdown at these critical levels will validate or invalidate this strategy.
FAQ:
Sources:
- Source Name: Macro Insights, Inc. - Internal Research Note, May 5, 2026.
- Source Name: Trading Analysis - SPX Technical Overview - Read more
To get the best results, use a trading platform to help you.


.png)
.png)
.png)


COMMENTS (0)