
 Français
 Spanish
 Deutsch
 Português
 Türkçe
 Italiano
 العربية
 Русский
 Chinese
 Korean
 Japanese
 Vietnamese
 Hebrew
 Hindi
Hindi
 Greek
Greek
 Polish
 Thai
Thai
 Dutch
Dutch
 Malay
Malay
TQQQ at Critical Level: Why This Week Matters
At a time when the financial world holds its breath, waiting for the next market move, the TQQQ, a leveraged ETF closely tracking the Nasdaq-100, has caught everyone's attention. A startling 7.12% drop today isn't just a blip on the radar—it's a seismic shift demanding immediate inspection. With the market's eyes fixed on every tick, the stakes have never been higher. But what's truly driving TQQQ's plunge, and what does it signal for the broader market? Investors are left asking: Is this a harbinger of further turmoil, or an opportunity hiding in plain sight?
In periods of market turbulence, the TQQQ becomes a lightning rod for sentiment. This ETF, designed to amplify the performance of the Nasdaq-100, serves as both an accelerant and indicator of tech sector sentiment. Today, the risk-off mode has gripped the markets as both the S&P 500 and Nasdaq-100 slip, down 1.07% and 1.51% respectively, dragging TQQQ with them. But here's where it gets interesting: the macroeconomic backdrop—a strengthening US Dollar and rising bond yields—compounds the pressure on TQQQ, magnifying today’s losses.
WHY TQQQ ETF IS MOVING TODAY
Understanding the 7.12% drop in TQQQ isn't just about numbers—it's about the confluence of market dynamics. The ETF, notorious for its leverage, typically magnifies movements in the Nasdaq-100. Today, it's experiencing a much deeper dive compared to the QQQ's 1.51% decline. Why? A stronger US Dollar, up 0.18%, coupled with rising bond yields, makes tech stocks less attractive. This risk-off sentiment shuffling capital from equities into safer assets is a classic move that investors know all too well. But does TQQQ's plunge point to a broader trend, or is it an isolated incident? With high volume trading at 117.56 million, today's movement is underpinned by strong selling conviction, and traders around the globe are glued to their screens.
MARKET CONTEXT
The broader context paints a picture of a market in retreat. The S&P 500 and Nasdaq-100's declines confirm the risk-off sentiment prevalent today. In such an environment, leveraged ETFs like TQQQ feel the heat more intensely. The macroeconomic conditions—a robust US Dollar and rising yields—only add fuel to the fire. As these conditions typically draw capital away from equities, especially tech-heavy ones, the TQQQ's amplified moves reflect a heightened state of investor caution. The question remains: Is this the calm before the storm, or a temporary overreaction in an otherwise resilient market?
THE CURRENT SETUP
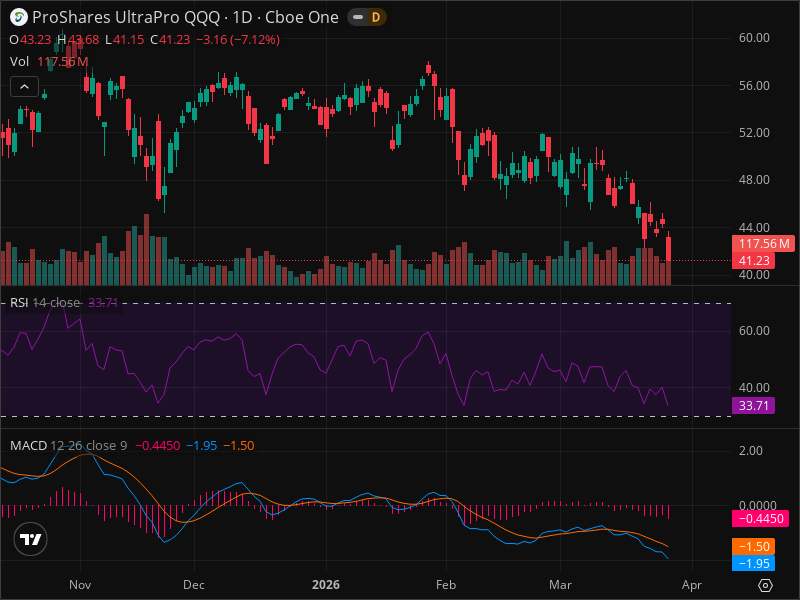
The TQQQ stands at a pivotal point, trading at $41.23. This price is not just a data point—it's a gateway to understanding what's next. The ETF is entrenched in a bearish trend, with a significant red candle signaling strong selling pressure and no apparent reversal patterns offering solace. High trading volume today only confirms the downward momentum, a telltale sign that the market's conviction in this trend is strong. As traders eye key support at $40.00, the psychological barrier that could act as a floor, the stakes are clear: hold this level, or face further declines.
TECHNICAL DEEP DIVE
In times of volatility, technical analysis becomes an indispensable tool. The TQQQ's RSI at 33.74 edges close to oversold territory, though it's crucial to remember that in a strong downtrend, RSI can stay low for extended periods. Meanwhile, the MACD's bearish position, with both lines below zero, confirms the downward trajectory. Adding to this picture, TQQQ is trading well below its moving averages—another layer of confirmation for the bears. Resistance sits at $44.00, $48.00, and $52.00, levels that seem distant under the current bearish cloud. Support at $40.00 and below at $36.00 and $32.00 are the tiers to watch as potential landing zones should the decline persist.
THE THREE SCENARIOS
- Bullish Scenario (20% Probability): A market stabilization, softer US Dollar, and lower bond yields could see TQQQ recovering to $44.00 or even $48.00 within weeks. But this upside hinges on external catalysts—positive tech news, perhaps—that currently seem elusive.
- Bearish Scenario (60% Probability): As the most likely path, continued risk-off sentiment could drag TQQQ down to $40.00 or $36.00 as investors flee to safety. Persistence of current macro trends supports this scenario.
- Neutral/Consolidation Scenario (20% Probability): A range-bound market between $40.00 and $44.00 could emerge, albeit temporarily, as uncertainty reigns.
TRADING STRATEGY
For traders eyeing TQQQ, the recommendation leans towards a cautious SELL or HOLD. Given the bearish momentum and the leveraged nature of this ETF, initiating new long positions is fraught with risk at this juncture. For current short positions, a stop loss at $44.00 mitigates risk, while potential take profits at $40.00 and $36.00 offer a reasonable reward profile. In this environment, employing AI analysis tools can provide a critical edge in timing trades effectively.
RISK FACTORS
Investors should brace for volatility. Key risks include continued strength in the US Dollar, further rises in bond yields, and any tech sector disruptions. Moreover, the potential for a market sentiment shift triggering a short squeeze could quickly reverse positions, underscoring the importance of disciplined risk management.
THE BOTTOM LINE
For those navigating today's choppy waters, holding back on new long positions in TQQQ seems prudent. The current setup, rife with bearish signals, demands caution. Without significant market shifts, the path of least resistance remains down. Smart investors are using AI-powered analysis tools to spot these patterns early, gaining the advantage needed in such unpredictable times.
KEY TAKEAWAYS
- TQQQ down 7.12%, highlighting market risk-off sentiment.
- Current price at $41.23, with high volume confirming the downward trend.
- RSI at 33.74, nearing oversold but can remain low in a strong downtrend.
- MACD bearish, with both lines below zero.
- Key support at $40.00, resistance at $44.00, $48.00, and $52.00.
- Bearish scenario most probable with 60% likelihood.
- Trading strategy leans SELL/HOLD; avoid new long entries.
- A daily close above $44.00 would invalidate immediate bearish outlook.
- Use AI analysis tools for optimal trade timing.
FINAL VERDICT
Actionable Recommendation:
- ACTION: SELL
- Confidence Level: 70%
- Entry Price: N/A (avoid new positions)
- Stop Loss: $44.00
- Take Profit: $36.00
- Risk/Reward: 1:1.86
- Success Probability: 60%
- Timeframe: 1-2 weeks
WHY THIS TRADE: The consistent bearish momentum, coupled with macroeconomic conditions, suggests continued downside for TQQQ. The current market setup and technical indicators align, advising a cautious stance.
WHAT MUST HAPPEN: A close below $40.00 would confirm the bearish thesis, while a close above $44.00 would signal potential reversal.
FAQ
SOURCES & REFERENCES
- Motley Fool: "TQQQ and SPXL...offer 3x daily market exposure with different focuses..."
- Motley Fool: "2 Reasons to Buy TQQQ, and 3 Reasons Not To"
READY TO TRADE TQQQ LIKE A PRO?
InteractiveCrypto Pro gives you the edge with:
- AI-Powered Signals - 94% accuracy
- Real-time Fair Value Estimates
- 40+ Technical Indicators
- Instant alerts on key levels
50% OFF - Just $6.49/month
COMPARE YOUR OPTIONS:
Compare trading platforms to find the best tools for your strategy.


.png)
.png)
.png)


.jpg)


COMMENTS (0)