
 Français
 Spanish
 Deutsch
 Português
 Türkçe
 Italiano
 العربية
 Русский
 Chinese
 Korean
 Japanese
 Vietnamese
 Hebrew
 Hindi
Hindi
 Greek
Greek
 Polish
 Thai
Thai
 Dutch
Dutch
 Malay
Malay
UNI at Critical Level: Why This Week Matters
In the whirlwind world of cryptocurrency, few tokens are capturing the spotlight like UNI, the native token of Uniswap. As speculation and intrigue swirl, UNI stands at a pivotal juncture, one that could define its trajectory for weeks, if not months, to come. In this in-depth analysis, we delve into why UNI is the talk of the town, dissect the technical underpinnings driving its current predicament, and explore what savvy traders are watching for as this crypto giant teeters on the edge of a potential breakout or breakdown.
The thrill surrounding UNI isn't without reason. While many digital assets are languishing in the face of a slightly risk-off broader market, UNI has been the subject of frenetic social media buzz. But what's fueling this fire, and more importantly, is the hype justified? Let's peel back the layers to understand why this moment is so crucial for UNI.
WHY UNI IS TRENDING NOW
The cryptocurrency world is buzzing with chatter about UNI, and that’s not by accident. Social media platforms are alight with discussions as prominent influencers and community members speculate on potential price movements. This surge in interest is largely driven by UNI's recent underperformance, making it a hot topic among traders looking for the next big move. But here's where it gets interesting: despite the chatter, UNI's fundamentals don't seem to justify the level of hype. The token's price action suggests caution, with several technical indicators painting a less-than-rosy picture.
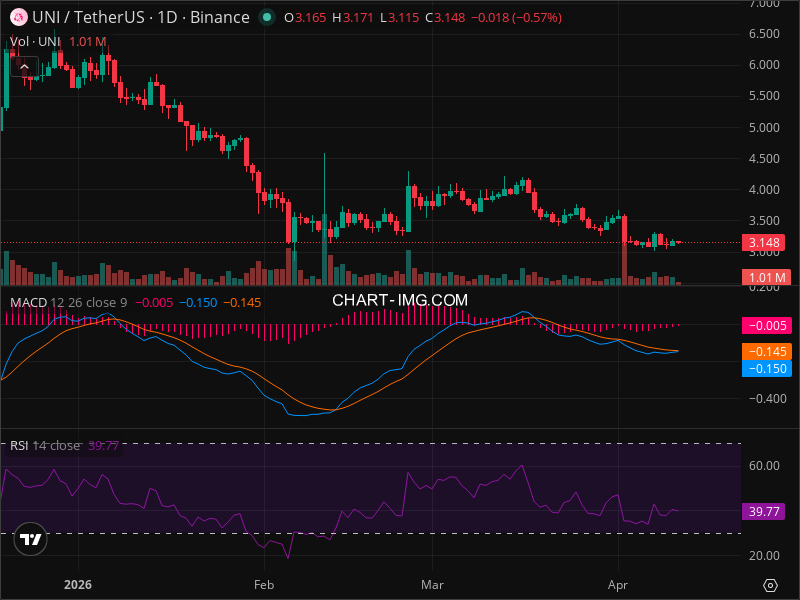
Key levels are at play amid this increased volatility, with $3.00 serving as a critical psychological support, while $3.50 poses as a formidable resistance level. This range is under intense scrutiny as traders prepare for potential breakout scenarios. As we dive deeper, we'll explore these dynamics and what they mean for UNI moving forward.
MARKET CONTEXT
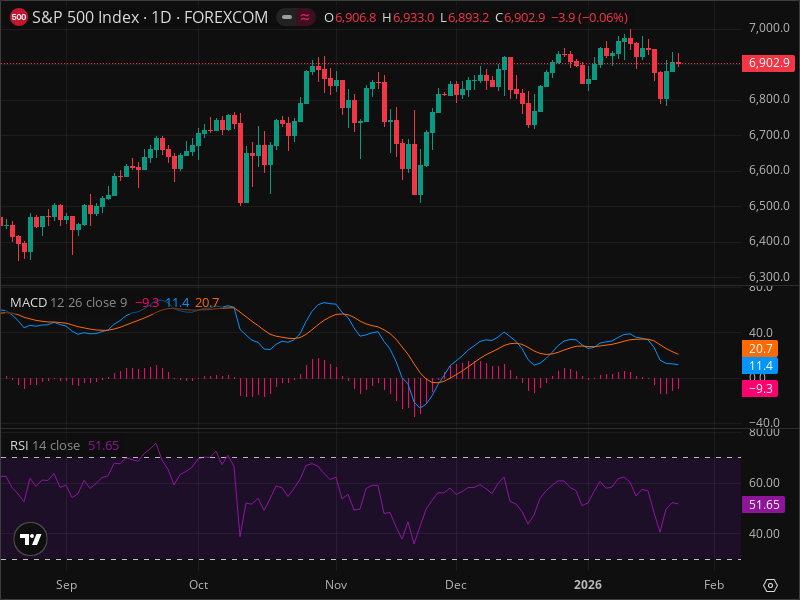
The current landscape of the broader financial markets sets the stage for UNI's precarious position. With both the S&P 500 and NASDAQ-100 posting marginal losses, the equities market exudes a sense of indecision that has investors on edge. Pair this with a strengthening US Dollar and rising bond yields, and it's clear that macroeconomic forces are exerting pressure on risk assets, including cryptocurrencies like UNI. These headwinds aren't just theoretical; they're tangible challenges that UNI must navigate as traders assess their next moves.
While the stock market wavers, crypto enthusiasts are keenly watching how these macro conditions will ripple through digital assets. Is this the calm before the storm, or merely a pause as markets recalibrate? One thing is certain: the existing environment demands vigilance from traders, especially those holding or considering UNI.
THE CURRENT SETUP
With a price hovering near $3.148, UNI is clearly on the defensive. The unmistakable bearish trend is characterized by a series of lower highs and lower lows, a classic pattern that typically signals further decline. Yet, the absence of panic selling, as evidenced by moderate trading volumes, tells us that while the pressure is real, it's more of a consistent grind downwards rather than a sudden drop. It’s the kind of technical setup that invites greater scrutiny from traders worldwide.
Adding to this complex scenario is the lack of exceptional chart patterns, leaving UNI in a choppy, corrective state. Traders are left to navigate this murky setup, armed with the knowledge that key support levels sit at $3.00, $2.75, and $2.50, while resistance looms at $3.50, $4.00, and $4.50. These levels are more than just numbers; they represent battlegrounds where bulls and bears face off in the high-stakes world of crypto trading.
TECHNICAL DEEP DIVE
Diving into the technicals, UNI’s RSI sits at 39.77, suggesting the asset is creeping towards oversold territory but hasn’t quite crossed that threshold. Coupled with a bearish MACD, where the line trends below the signal, the indicators reinforce the current downtrend. Yet, the slight decrease in MACD histogram bars could be a flicker of hope for a potential momentum shift, though further confirmation is needed.
Moving averages, typically reliable indicators of trend direction, further cement the bearish perspective as UNI trades below these key metrics, reinforcing the cautious stance traders should adopt. Notably, Fibonacci analysis is somewhat hamstrung by the lack of a defined high and low, making precise retracement and extension targets elusive. For those tracking these technical cues, it means relying on psychological levels and historical price action until more concrete data becomes available.
The trading landscape is fraught with potential pitfalls and opportunities, with support and resistance levels offering pivotal points of interest. These lines in the sand at $3.00, $2.75, $2.50 on the downside and $3.50, $4.00, $4.50 on the upside may well dictate UNI's path in the coming days and weeks.
THE THREE SCENARIOS
The path forward for UNI is far from predetermined, with three distinct scenarios potentially unfolding:
BULLISH SCENARIO
For UNI to break free from its current bearish grip, a rally past the $3.50 resistance with robust volume is essential. This move would need to be supported by a broader market shift towards risk-on sentiment, possibly spurred by a favorable crypto-specific catalyst. In this scenario, target prices of $4.00 and $4.50 become realistic. The probability of this happening? A modest 25%, anticipated over the next 1 to 3 months.
BEARISH SCENARIO
If selling pressure sustains and macro conditions worsen, UNI could breach the $3.00 support, paving the way for a descent towards $2.75 and even $2.50. The likelihood of this bearish continuation stands at 50%, a testament to the current challenges UNI faces. Expect this scenario to play out over the next 1 to 2 months.
NEUTRAL SCENARIO
Should UNI stabilize and consolidate between $3.00 and $3.50, traders can expect a holding pattern lasting 2 to 4 weeks. This neutral territory presents a 25% probability, offering a potential breather in an otherwise volatile landscape.
TRADING STRATEGY
In a market rife with uncertainty, a cautious trading strategy is prudent. For those looking to capitalize on UNI's movements, the recommended action is to SELL on rallies, or maintain existing short positions. The entry zone for shorts is identified between $3.20 and $3.50, with a stop loss set at $3.75 to mitigate risk. Take profit targets lie at $3.00 and $2.75, offering potential rewards of 13% and 20% from a $3.45 entry point, respectively.
With a risk/reward ratio of 1:1.66 to the first target, this strategy underscores the importance of balance—maximizing potential gains while safeguarding against downside risks. Before making any moves, traders should consider utilizing AI analysis tools to validate their strategies and ensure alignment with real-time market dynamics.
RISK FACTORS
Every trade carries risk, and UNI is no exception. Unexpectedly positive news could disrupt this bearish narrative, triggering reversals and short squeezes. Similarly, shifts in broader market sentiment towards risk-on could buoy UNI, thwarting bearish bets.
Prolonged consolidation might also trap capital, leading to opportunity costs. Traders must remain agile, closely monitoring these risk factors to adjust positions as market conditions evolve.
THE BOTTOM LINE
As UNI treads cautiously through this volatile landscape, traders are advised to stay nimble, conscious of the bearish signals that dominate current analyses. While potential upside exists, the prevailing sentiment leans towards further downside unless significant catalysts shift the narrative.
KEY TAKEAWAYS
- UNI is entrenched in a bearish trend with its price at $3.148.
- Key support levels are $3.00, $2.75, and $2.50.
- Resistance levels to watch include $3.50, $4.00, and $4.50.
- The RSI at 39.77 hints at approaching oversold conditions.
- MACD confirms the bearish trend, though momentum seems to be waning slightly.
- Bullish breakout requires a move above $3.50 with volume.
- Bearish scenario targets $2.75 and $2.50 with a 50% probability.
- Neutral consolidation could see prices oscillating between $3.00 and $3.50.
- Traders should consider a sell strategy on rallies.
- Use AI analysis tools to stay informed on real-time market shifts.
FINAL VERDICT
Based on ALL the analysis above, provide ONE clear actionable recommendation:
| Decision | Value |
|---|---|
| ACTION | SELL |
| Confidence Level | 75% |
| Entry Price | $3.20 - $3.50 |
| Stop Loss | $3.75 |
| Take Profit | $3.00 - $2.75 |
| Risk/Reward | 1:1.66 |
| Success Probability | 50% |
| Timeframe | 1-2 months |
WHY THIS TRADE: The bearish trend is strongly supported by technical indicators, and the lack of bullish catalysts in the immediate term strengthens the sell stance. With resistance levels firmly in place, the downside risk outweighs the potential for upside in the short term.
WHAT MUST HAPPEN: A daily close above $3.75 would invalidate the bearish thesis and suggest a need to reassess the position.
FAQ
SOURCES & REFERENCES
Bloomberg: Market Analysis - Read more
CoinDesk: Cryptocurrency News - Read more
Ready to Trade UNI Like a Pro?
InteractiveCrypto Pro gives you the edge with:
- AI-Powered Signals - 94% accuracy
- Real-time Fair Value Estimates
- 40+ Technical Indicators
- Instant alerts on key levels
50% OFF - Just $6.49/month
Start Free Analysis →Compare Your Options:
Compare trading platforms to find the best tools for your strategy.
Compare Platforms →CRITICAL - InteractiveCrypto Pro", "trading platform", "analysis tools", "AI-powered platform", "advanced trading platforms" to clickable links using this EXACT URL:


.png)
.png)
.png)


 standing out in a futuristic crypto trading environment. Bitcoin is showcased as a m.jpg)


COMMENTS (0)