Create a FREE account and...
Manage your own Watchlist
Access all education lessons
Converse with other crypto enthusiasts
Be a part of the Interactive Crypto Community
OR
Please fill out the required fields Please fill out the required fields Please fill out the required fields

As of December 30, 2025, the cryptocurrency market is at a pivotal crossroads, with Bitcoin anchoring itself at a steady $88,136 after weeks of heart-pounding volatility. This stabilization isn’t just a fleeting pause—it’s a potential launchpad for a historic rally, with some analysts whispering about a climb to $150,000 in the coming months. For investors, this moment is a clarion call: a chance to position yourself before the next big wave. Whether you’re a seasoned trader or just dipping your toes into crypto, this development could directly impact your portfolio. Let’s unpack why this matters, what the data reveals, and how you can navigate the opportunities ahead.
Bitcoin’s current price of $88,136, reflecting a modest 0.95% increase in the last 24 hours, is more than just a number—it’s a beacon of stability in a market that’s been anything but predictable. According to CoinGecko data, this leveling off comes after a rollercoaster of price swings in December 2025, driven by macroeconomic uncertainties and shifting investor sentiment. Meanwhile, the total crypto market capitalization stands at a robust $3.07 trillion, with Bitcoin’s dominance holding strong at 57.42%.
But it’s not just Bitcoin stealing the spotlight. Ethereum, trading at $2,967.28 with a 1.15% uptick, continues to assert its relevance, buoyed by anticipation for scalability upgrades. Altcoins like Solana ($124.44, +1.26%) and Ripple ($1.88, +1.28%) are also showing green, hinting at a broader market recovery. Yet, beneath the surface, the Fear & Greed Index lingers at a chilling 23, signaling “Extreme Fear.” Could this contrarian indicator mean the market is ripe for a rebound? If you’re looking to capitalize on this moment, consider platforms to start trading with confidence.
For investors, Bitcoin’s stabilization at $88,136 is a double-edged sword. On one hand, it suggests a potential bottoming out—a moment to buy low before a possible surge. On the other, the “Extreme Fear” sentiment warns of lingering risks, as retail investors might panic-sell while institutional players quietly accumulate.
The data paints a clear picture: periods of extreme fear often precede significant rallies, as seen in previous cycles documented by Alternative.me’s historical Fear & Greed Index trends. If you’re a long-term holder, this could be your window to build positions. Short-term traders, however, should watch volatility closely. Either way, having the right tools is crucial—consider platforms where you can open a trading account to stay ahead of market moves.
Bitcoin’s journey to $88,136 didn’t happen in a vacuum. Historically, stabilization phases after sharp corrections—like the one we’ve seen this month—often signal consolidation before a breakout. Bloomberg data highlights that similar patterns in 2021 and 2023 preceded rallies of over 50% within six months. Could history repeat itself?
Beyond crypto-specific factors, global economic conditions are playing a role. Rising interest rates and geopolitical tensions have spooked traditional markets, pushing some investors toward Bitcoin as a hedge. Yet, regulatory murmurs—especially in the U.S. and Europe—continue to cast a shadow, with potential crackdowns looming in 2026.
The “Extreme Fear” reading on the Fear & Greed Index is a psychological marker. When fear dominates, prices often reflect undervaluation, as retail investors flee. Institutional investors, however, see this as a buying signal, per recent reports from CNBC. This dichotomy could set the stage for a dramatic shift if sentiment flips.
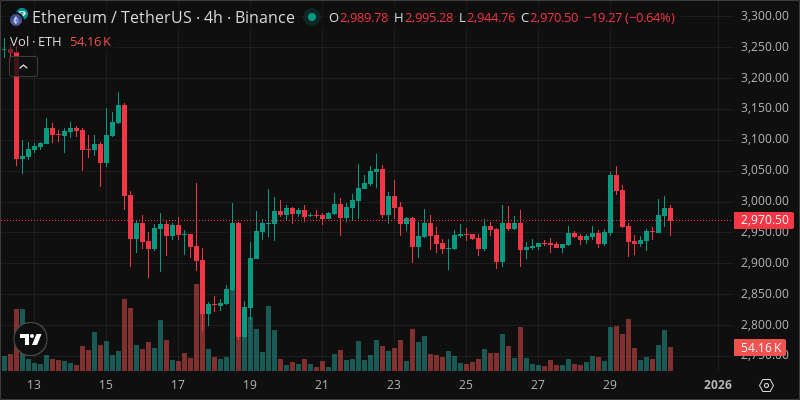
ETH Crypto Chart
Industry voices are buzzing with optimism tempered by caution. MicroStrategy CEO Michael Saylor, a vocal Bitcoin bull, recently tweeted that “stabilization at these levels often precedes exponential growth,” pointing to Bitcoin’s potential to hit $150,000 by mid-2026. Meanwhile, analysts at JPMorgan, as cited in Bloomberg, warn that regulatory headwinds could cap gains if not addressed.
On the industry front, Ethereum’s momentum is fueling optimism in the DeFi and NFT sectors, where transaction volumes are climbing. Solana’s low-fee structure continues to attract developers, while Ripple’s legal wins are boosting confidence in its cross-border payment solutions. For those looking to dive into these opportunities, get started with a reliable platform to explore these assets.
Bitcoin’s 57.42% market dominance underscores its role as a portfolio anchor. But with Ethereum and altcoins like Solana showing strength, diversification could mitigate risk while capturing upside. A balanced approach—perhaps 60% Bitcoin, 30% Ethereum, and 10% altcoins—might suit moderate-risk investors.
Short-term traders might focus on Bitcoin’s daily price swings, leveraging its 0.95% uptick for quick profits. Long-term investors, however, should eye the $150,000 predictions, holding through volatility. Data from CoinGecko shows that holding periods of over 12 months have historically yielded higher returns during bullish cycles.
Current prices offer a potential entry point, especially with fear-driven undervaluation. But risk management is key—setting stop-loss orders and avoiding over-leverage can protect against sudden drops. Platforms that support strategic trading can be invaluable; consider trying a trusted trading service to refine your approach.
From a technical standpoint, Bitcoin’s $88,136 stabilization aligns with key support levels around $85,000, a threshold that has held firm in past corrections, per CoinGecko charts. The Relative Strength Index (RSI) currently sits at 42, indicating neither overbought nor oversold conditions—just a neutral zone ripe for a breakout.
Moving averages tell a similar story. The 50-day moving average is trending upward, crossing above the 200-day average—a bullish “golden cross” signal. Trading volume, while not explosive, shows steady accumulation, suggesting smart money is quietly positioning. Ethereum mirrors this trend, with its RSI at 45 and support at $2,900 holding strong.
Below is a snapshot of key metrics for major cryptocurrencies:
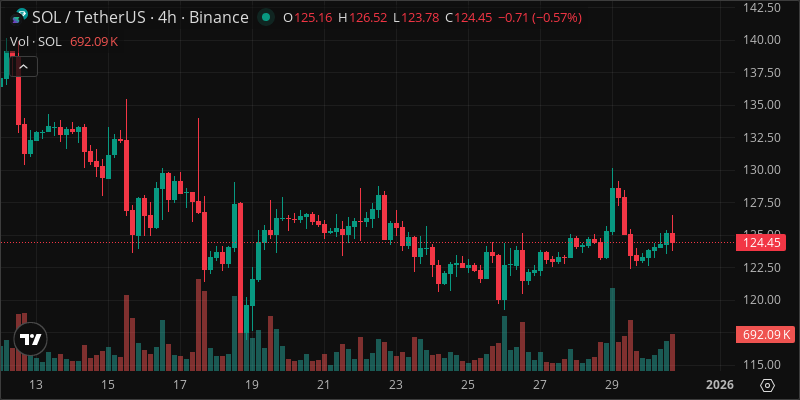
SOL Crypto Chart
| Cryptocurrency | Current Price | 24h Change | Market Dominance |
|---|---|---|---|
| Bitcoin | $88,136 | +0.95% | 57.42% |
| Ethereum | $2,967.28 | +1.15% | 11.67% |
| Solana | $124.44 | +1.26% | N/A |
| Ripple | $1.88 | +1.28% | N/A |
Looking ahead, the $150,000 Bitcoin prediction isn’t just wishful thinking—it’s grounded in historical trends and current accumulation patterns. Analysts at Bloomberg suggest that if institutional adoption continues—think more firms like MicroStrategy stacking Bitcoin on their balance sheets—this target could be within reach by Q3 2026.
Ethereum, too, has a bright horizon, with upgrades potentially pushing its price past $4,000. Altcoins like Solana and Ripple could ride this wave, especially if DeFi and cross-border payment adoption accelerate. But risks remain: regulatory clampdowns or a broader economic downturn could derail momentum. For those ready to act on these forecasts, start trading now to position yourself for potential gains.
Bitcoin at $88,136 could be a strategic entry point, especially given historical patterns of recovery after stabilization. However, investors should assess their risk tolerance and monitor market sentiment, as “Extreme Fear” can signal both opportunity and volatility.
The Fear & Greed Index reading of 23 reflects widespread uncertainty, driven by recent price drops, macroeconomic pressures, and regulatory concerns. According to Alternative.me, such levels often indicate undervaluation, which could attract contrarian investors.
Ethereum’s $2,967.28 price and 1.15% uptick suggest strength, particularly with upcoming upgrades. Altcoins like Solana and Ripple show promise, but others like Cardano and Stellar are lagging. Research individual fundamentals before deciding.
Key risks include regulatory changes, market volatility, and broader economic downturns. A sudden policy shift in major markets like the U.S. could impact prices. Always use risk management strategies like stop-loss orders.
Getting started is easier than ever with user-friendly platforms. You can open an account today to explore Bitcoin, Ethereum, and altcoins, ensuring you have the tools to track and trade effectively.
Analysts, including those cited by Bloomberg, see $150,000 as feasible by mid-2026 if institutional adoption grows and macroeconomic conditions stabilize. However, this hinges on avoiding major regulatory or economic disruptions.


ALL
TRENDING
WATCHLIST
Total Market Cap The Total Market Capitalization (Market Cap) is an indicator that measures the size of all the cryptocurrencies.It’s the total market value of all the cryptocurrencies' circulating supply: so it’s the total value of all the coins that have been mined.
{[{ marketcap }]} {[{ marketcapchange.toLocaleString(undefined, {maximumFractionDigits:2}) }]}% (24H) {[{ marketcapchange.toLocaleString(undefined, {maximumFractionDigits:2}) }]}% (24H)
Symbol
Price Cryptocurrency prices are volatile, and the prices change all the time. We are collecting all the data from several exchanges to provide the most accurate price available.
24H Cryptocurrency prices are volatile… The 24h % change is the difference between the current price and the price24 hours ago.
Trade
{[{ item.name }]}
{[{ index + $index}]}
{[{ item.pair.split('_')[0] }]}
Ƀ{[{item.price.toLocaleString(undefined, {maximumFractionDigits: 5}) }]} ${[{item.price.toLocaleString(undefined, {maximumFractionDigits: 5}) }]}
{[{ item.change24.toLocaleString(undefined, {maximumFractionDigits: 2}) }]}%
{[{ item.change24.toLocaleString(undefined, {maximumFractionDigits: 2}) }]}%
Symbol
Price Cryptocurrency prices are volatile, and the prices change all the time. We are collecting allthe data fromseveral exchanges to provide the most accurate price available.
24H Cryptocurrency prices are volatile… The 24h % change is the difference between the current priceand the price24 hours ago.
Trade
{[{ item.name }]}
{[{ index + $index}]}
{[{ item.pair.split('_')[0] }]}
Ƀ{[{item.price.toLocaleString(undefined, {maximumFractionDigits: 5}) }]} ${[{item.price.toLocaleString(undefined, {maximumFractionDigits: 5}) }]}
{[{ item.change24.toLocaleString(undefined, {maximumFractionDigits: 2}) }]}%
{[{ item.change24.toLocaleString(undefined, {maximumFractionDigits: 2}) }]}%


BTC Technical Analysis
May 27, 2026 | Joanna Newman

Soybeans Technical Analysis
May 27, 2026 | Joanna Newman
Live Cattle Technical Analysis
May 27, 2026 | Joanna Newman

DJI Technical Analysis
May 27, 2026 | Joanna Newman
Tezos (XTZ) Review 2024: Everything You Need to Know Before Buying Tezos
.article-container { font-family: Arial, sans-serif; line-height: 1.6; color: #333; backgrou...
Chromia (CHR) Review 2024: Everything You Need to Know Before Buying Chromia
Illuvium (ILV) Review 2024: Everything You Need to Know Before Buying Illuvium
My Neighbor Alice (ALICE) Review 2024: Everything You Need to Know Before Buying My Neighbor Alice
Star Atlas (ATLAS) Review 2024: Everything You Need to Know Before Buying Star Atlas
TabTrade
What Is TabTrade? A Complete IntroductionTabTrade is a globally oriented multi-asset CFD and forex b...
Funded7
In the fast-moving world of proprietary trading, 2026 has marked a significant shift in what traders...
Bullwaves
Bullwaves Review 2026: A Premium MT5 Brokerage for Multi-Asset TradersBullwaves has quickly carved o...
BlackBull Markets
...
OQtima
Oqtima is an emerging online trading platform that offers a wide range of financial instruments, inc...
(adsbygoogle = window.adsbygoogle || []).push({}); Introduction In t...
(adsbygoogle = window.adsbygoogle || []).push({}); Einführung Wenn es um Er...
Mobi
Are you someone who makes international payments regularly using Bitcoin? Or do you travel a lot and...
Bitcoin.com
Bitcoin.com is a free downloadable Bitcoin wallet that allows users to trade and receive Bitcoins. T...
BTC.com
Created by Bitmain in 2016, BTC.com is a leading open-source Bitcoin and Bitcoin Cash storage platfo...
Bitcoin Price Analysis: Why Experts Predict a $150K Surge as $88,136 Stabilization Signals Major Shift
/* Modern SEO & AI-Optimized Article Styles */ /* Fonts loaded via link tags in head for b
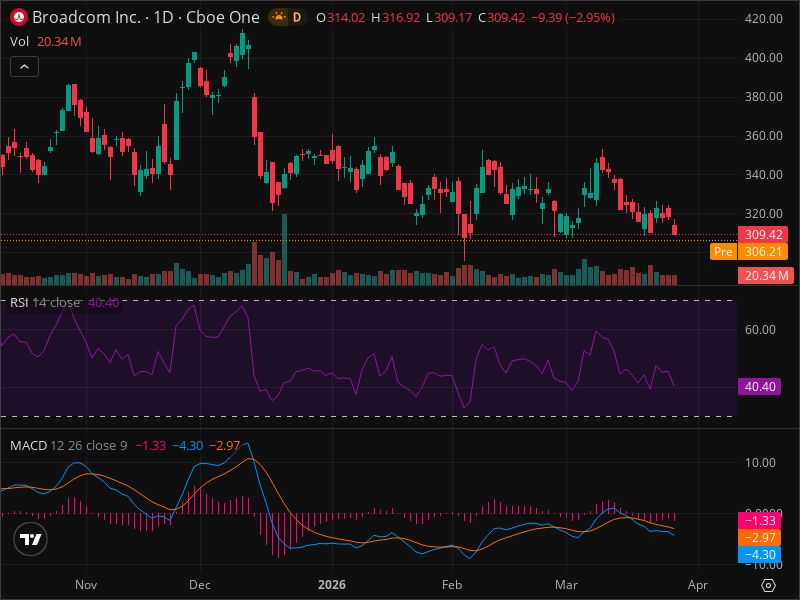
AVGO Breakout Imminent? 5 Chart Patterns Aligning Now
AVGO Breakout Imminent? 5 Chart Patterns Aligning Now AVGO Chart | TradingView
Nevada’s Kalshi Ban: Why This Could Be a Game-Changer for Crypto Markets in 2026
/* Modern SEO & AI-Optimized Article Styles */ /* Fonts loaded via link tags in head for b
Mongolia's Largest Bank to Offer Crypto Services
Mongolia's largest bank, Trade & Development Bank, plans to offer crypto services. The repor
Tokocrypto Exchange Review: Is It the Best Choice for Crypto Trading in 2024?
body { font-family: Arial, sans-serif; line-height: 1.6; padding: 20px; background-colo
The Top 10 Crypto Assets with the Highest Potential in 2025
.article-container { font-family: Arial, sans-serif; line-height: 1.6; color: #333; background-color
The Ultimate Bitcoin Review 2024: Everything You Need to Know Today
.article-container { font-family: Arial, sans-serif; line-height: 1.6; color: #333; background-colo
The Everyday Fruit that's a Powerhouse of Nutrition and Your Weight Loss Ally
(adsbygoogle = window.adsbygoogle || []).push({}); IntroductionWhen it comes to nutrition a
The oldest and most powerful remedy to permanently get rid of insects and ants
(adsbygoogle = window.adsbygoogle || []).push({}); IntroductionEach year, as the hot season
Two Beds, One Dream: The Growing Trend of Sleeping Apart for Better Rest
(adsbygoogle = window.adsbygoogle || []).push({}); IntroductionIn an era where quality slee
(adsbygoogle = window.adsbygoogle || []).push({}); Introduction In t...
(adsbygoogle = window.adsbygoogle || []).push({}); Einführung Wenn es um Er...
Mobi
Are you someone who makes international payments regularly using Bitcoin? Or do you travel a lot and...
Bitcoin.com
Bitcoin.com is a free downloadable Bitcoin wallet that allows users to trade and receive Bitcoins. T...
BTC.com
Created by Bitmain in 2016, BTC.com is a leading open-source Bitcoin and Bitcoin Cash storage platfo...

 Français
 Spanish
 Deutsch
 Português
 Türkçe
 Italiano
 العربية
 Русский
 Chinese
 Korean
 Japanese
 Vietnamese
 Hebrew
 Hindi
Hindi
 Greek
Greek
 Polish
 Thai
Thai
 Dutch
Dutch
 Malay
Malay


.png)
.png)
.png)


COMMENTS (0)